File:2014.12.29rubleDollar.png
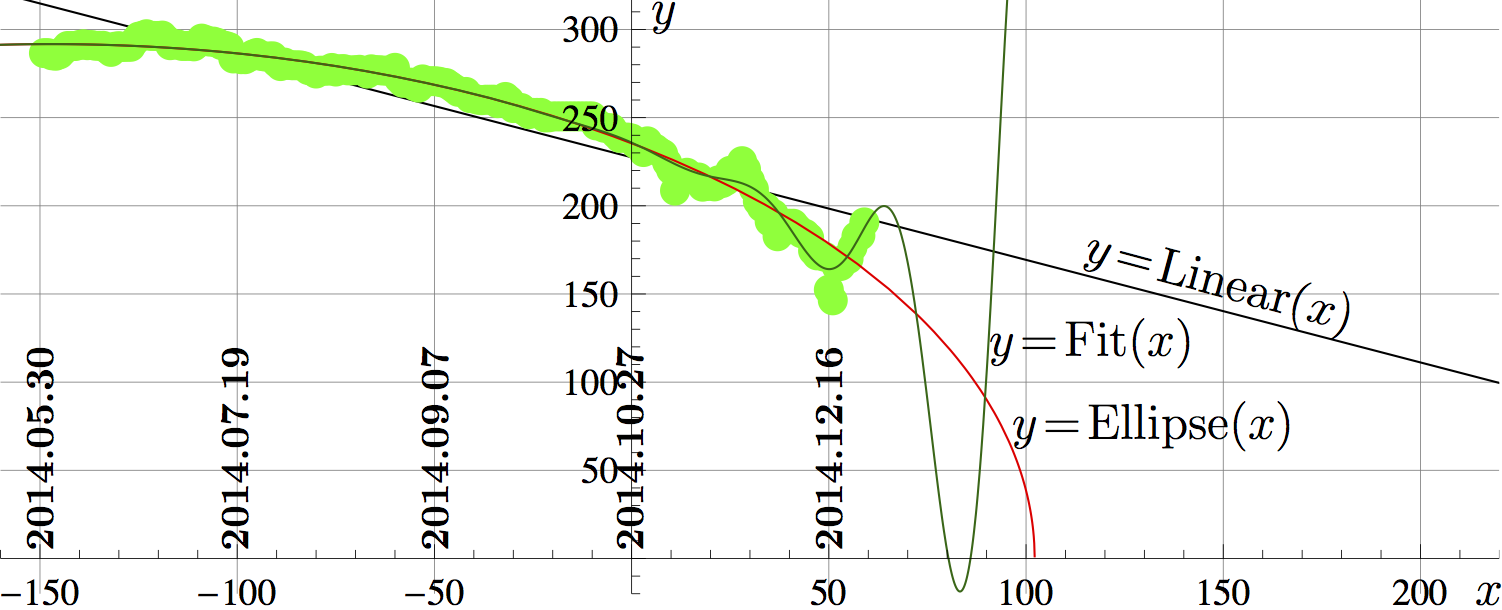
Value of 100 Russian roubles, measured in the USA cents, versus time $x$, and the approximations. The approximations are prepared 2014.12.29 for the future comparison with experimental data.
Abscissa $x$ is time, measured in days since the beginning of the project, 2014.10.27.
Ordinate $y$ neas the value of 100 roubles, measured in the USA cents.
The green dots (taht form the scratched green line) represent the data from https://www.mataf.net/en/currency/converter-USD-RUB
The straight black line represents the linear approximation of the data,
$y=\mathrm{Linear}(x)=227.499 - 0.581655 x$
The red monotonous line represents the approximation with ellipse,
$\displaystyle y=\mathrm{Ellipse}(x)=1.16997 \sqrt{ (102.182 - x) (396.475 + x)}$
The dark green oscillating curve represents the fitting of experimental data with function
$y=\mathrm{Fit}(x)=\mathrm{Ellipse}(x)+0.959481\, \exp(0.0601124 x)\, \sin\!\big( 0.179949 (-54.6949 + x)\big)$
For the Fit, the mean deviation $D=3.16$
and the mean square deviation $Q=4.23$
Mathematica generator of curves
g = Import["~/Q/RUBLE/TRY03/ddat.txt", "Table"];
T[i_] := Extract[Extract[g, i], 1];
G[i_] := Extract[Extract[g, i], 2]; M = Length[g]
212
g
{{-149, 286.6}, {-148, 286.6}, {-147, 285.36}, {-146, 285.1}, {-145, 285.95},
{-144, 288.23}, {-143, 290.64}, {-142, 290.62}, {-141, 290.62}, {-140, 291.24},
{-139, 291.63}, {-138, 291.08}, {-137, 291.17}, {-136, 290.78}, {-135, 290.74},
{-134, 290.74}, {-133, 289.}, {-132, 287.27}, {-131, 290.23}, {-130, 290.55},
{-129, 290.07}, {-128, 290.17}, {-127, 290.17}, {-126, 293.33}, {-125, 295.93},
{-124, 296.41}, {-123, 297.31}, {-122, 296.36}, {-121, 296.34}, {-120, 296.34},
{-119, 296.54}, {-118, 294.24}, {-117, 291.08}, {-116, 291.51}, {-115, 291.5},
{-114, 290.66}, {-113, 290.66}, {-112, 290.8}, {-111, 290.42}, {-110, 292.13},
{-109, 294.83}, {-108, 294.01}, {-107, 293.12}, {-106, 293.12}, {-105, 292.4},
{-104, 291.16}, {-103, 290.7}, {-102, 289.97}, {-101, 283.56}, {-100, 284.43},
{-99, 283.14}, {-98, 283.14}, {-97, 284.33}, {-96, 285.84}, {-95, 286.7},
{-94, 285.03}, {-93, 284.67}, {-92, 284.67}, {-91, 284.78}, {-90, 281.22},
{-89, 279.23}, {-88, 281.23}, {-87, 279.89}, {-86, 279.69}, {-85, 279.69},
{-84, 279.63}, {-83, 279.08}, {-82, 277.01}, {-81, 276.44}, {-80, 275.02},
{-79, 276.63}, {-78, 276.63}, {-77, 276.63}, {-76, 278.19}, {-75, 276.14},
{-74, 277.44}, {-73, 277.55}, {-72, 276.8}, {-71, 276.8}, {-70, 276.9},
{-69, 277.15}, {-68, 276.38}, {-67, 274.97}, {-66, 277.41}, {-65, 276.91},
{-64, 276.91}, {-63, 276.69}, {-62, 276.66}, {-61, 276.51}, {-60, 278.26},
{-59, 272.08}, {-58, 269.77}, {-57, 269.77}, {-56, 269.85}, {-55, 267.89},
{-54, 267.}, {-53, 271.69}, {-52, 270.57}, {-51, 270.67}, {-50, 270.67},
{-49, 270.45}, {-48, 269.93}, {-47, 269.59}, {-46, 268.02}, {-45, 266.44},
{-44, 264.65}, {-43, 264.65}, {-42, 264.59}, {-41, 261.08}, {-40, 260.85},
{-39, 260.19}, {-38, 259.89}, {-37, 260.18}, {-36, 260.18}, {-35, 260.2},
{-34, 258.19}, {-33, 259.19}, {-32, 261.74}, {-31, 259.78}, {-30, 255.41},
{-29, 255.41}, {-28, 255.47}, {-27, 253.6}, {-26, 251.98}, {-25, 252.71},
{-24, 252.71}, {-23, 252.71}, {-22, 250.12}, {-21, 250.16}, {-20, 250.7},
{-19, 250.7}, {-18, 250.7}, {-17, 250.7}, {-16, 250.7}, {-15, 250.7},
{-14, 250.7}, {-13, 250.7}, {-12, 250.7}, {-11, 250.7}, {-10, 250.7},
{-9, 245.59}, {-8, 245.59}, {-7, 244.29}, {-6, 244.08}, {-5, 243.9},
{-4, 240.73}, {-3, 238.51}, {-2, 238.69}, {-1, 238.69}, {0, 238.18},
{1, 235.07}, {2, 233.92}, {3, 230.48}, {4, 236.57}, {5, 232.41},
{6, 232.41}, {7, 230.63}, {8, 229.33}, {9, 224.56}, {10, 220.42},
{11, 208.61}, {12, 214.13}, {13, 214.54}, {14, 218.75}, {15, 216.71},
{16, 215.48}, {17, 216.06}, {18, 210.84}, {19, 211.21}, {20, 211.68},
{21, 211.}, {22, 214.45}, {23, 212.92}, {24, 214.27}, {25, 219.87},
{26, 218.47}, {27, 218.47}, {28, 225.32}, {29, 220.79}, {30, 214.3},
{31, 209.51}, {32, 202.55}, {33, 199.15}, {34, 199.15}, {35, 191.1},
{36, 195.33}, {37, 182.72}, {38, 189.91}, {39, 186.14}, {40, 189.83},
{41, 189.83}, {42, 187.19}, {43, 184.48}, {44, 184.11}, {45, 181.95},
{46, 174.51}, {47, 171.89}, {48, 171.89}, {49, 171.08}, {50, 152.41},
{51, 146.39}, {52, 165.41}, {53, 165.88}, {54, 169.84}, {55, 169.84},
{56, 176.53}, {57, 182.76}, {58, 183.13}, {59, 190.59}, {60, 195.9}, {61, 195.89}, {62, 195.89}}
lp = ListPlot[g, PlotStyle -> {{RGBColor[0, 1, 0], PointSize[0.02]}}, AspectRatio -> .5];
F1[x_] = a x + b; par =
FindFit[g, F1[x], {a, b}, x]; {f1[x_] = ReplaceAll[F1[x], par],
r1 = Sum[Abs[G[i] - f1[T[i]]], {i, 1, M}]/M,
q1 = Sqrt[Sum[(G[i] - f1[T[i]])^2, {i, 1, M}]/M]}
p1 = Plot[f1[x], {x, -160, 220},
PlotRange -> {{-160, 220}, {-20, 320}},
PlotStyle -> {RGBColor[0, 0, 0]},
GridLines -> {{-150, -100, -50, 50, 100, 150, 200}, {50, 100, 150,
200, 250, 300}}, AspectRatio -> .4];
Show[p1, lp]
{227.499 - 0.581655 x, 10.3954, 13.0679}
F11[x_] =
c Sqrt[(a + 200 + x) (b + 100 - x)] +
e0 E^(0.028 e1 x) Sin[1/(16 (1 + e2)) \[Pi] (-54 + e3 + x)]; par =
FindFit[g, F11[x], {a, b, c, e0, e1, e2, e3}, x,
MaxIterations -> 1000];
{f11[x_] = ReplaceAll[F11[x], par],
r11 = Sum[Abs[G[i] - f11[T[i]]], {i, 1, M}]/M,
q11 = Sqrt[Sum[(G[i] - f11[T[i]])^2, {i, 1, M}]/M]}
p11 = Plot[f11[x], {x, -160, 220},
PlotRange -> {{-160, 220}, {-20, 320}},
PlotStyle -> {RGBColor[0, .4, 0]},
GridLines -> {{-150, -100, -50, 50, 100, 150, 200}, {50, 100, 150,
200, 250, 300}}, AspectRatio -> .4];
Show[p1, lp, p11]
{1.16997 Sqrt[(102.182 - x) (396.475 + x)] +
0.959481 E^(0.0601124 x)
Sin[0.179949 (-54.6949 + x)], 3.16084, 4.22729}
p11q = Plot[
1.1699692028638327` Sqrt[(102.18232788369797` -
x) (396.47525643214055` + x)], {x, -160, 220},
PlotRange -> {{-160, 220}, {-20, 320}},
PlotStyle -> {RGBColor[1, 0, 0]},
GridLines -> {{-150, -100, -50, 50, 100, 150, 200}, {50, 100, 150,
200, 250, 300}}, AspectRatio -> .4]
p13 = Show[p1, lp, p11q, p11]
Export["p13.pdf", p13]
Latex generator of labels
\documentclass[12pt]{article}
\usepackage{geometry}
\usepackage{graphicx}
\usepackage{rotating}
\usepackage{color}
\definecolor{pink}{RGB}{255,127,255}
\paperwidth 724pt
\paperheight 294pt
%\paperheight 614pt
\textwidth 800pt
\textheight 400pt
%\topmargin -92pt
\topmargin -100pt
\oddsidemargin -90pt
\newcommand \sx {\scalebox}
\newcommand \rot {\begin{rotate}}
\newcommand \ero {\end{rotate}}
\begin{document}
\begin{picture}(730,286)
%\put(46,20){\sx{14.9}{\color{pink} \circle{50}}}
%\put(10,10){\includegraphics{rusa2014.10.28c}}
%\put(10,10){\includegraphics{dollarplot}}
%\put(0,0){\sx{2}{\includegraphics{s1234}}}
%\put(0,0){\sx{2}{\includegraphics{s18}}}
\put(0,0){\sx{2}{\includegraphics{p13}}}
%\put(10,10){\includegraphics{rusa2014.10.28c}}
%\put(10,10){\includegraphics{05.pdf}}
%\put(-10,0){\circle(200)}
%\put(0,-40){\sx{16}{\color{magenta} \circle{50}}}
%\put(270,299){\sx{1.7}{$y=$ Price of 100 Rubles}}
%\put(310,280){\sx{1.7}{In the USA cents}}
\put(314,284){\sx{2}{$y$}}
%\put(-4,296){\sx{1.3}{in cents}}
%\put(-4,282){\sx{1.3}{of USA}}
%\put(0,210){\sx{2.5}{2}}
%\put(0,110){\sx{2.5}{1}}
%\put(0,10){\sx{2.5}{0}}
%\put(80,-4){\sx{2.5}{$-100$}}
%\put(214,-4){\sx{2.5}{$0$}}
%\put(300,-4){\sx{2.5}{$100$}}
%\put(400,-4){\sx{2.5}{$200$}}
%\put(500,-4){\sx{2.5}{$300$}}
%\put(600,-2){\sx{2.5}{$400$}}
\put(711,4){\sx{2}{$x$}}
\put(26,30){\sx{1.6}{\rot{90}{\bf 2014.05.30}\ero}}
\put(120,30){\sx{1.6}{\rot{90}{\bf 2014.07.19}\ero}}
\put(216,30){\sx{1.6}{\rot{90}{\bf 2014.09.07}\ero}}
\put(310,30){\sx{1.6}{\rot{90}{\bf 2014.10.27}\ero}} %
\put(406,30){\sx{1.6}{\rot{90}{\bf 2014.12.16}\ero}} %
%\put(502,190){\sx{2.}{\rot{90}{\bf 2015.02.23}\ero}}
%\put(596,190){\sx{2.}{\rot{90}{\bf 2015.04.13}\ero}}
%\put(693,190){\sx{2.}{\rot{90}{\bf 2015.05.15}\ero}}
%\put(414,172){\sx{2.}{\rot{90}{\bf 2015.05.15}\ero}}
%\put(592,150){\sx{2}{\rot{-15}{$y\!=\!\mathrm{Linear}(x)$}\ero}}
\put(522,170){\sx{2}{\rot{-15}{$y\!=\!\mathrm{Linear}(x)$}\ero}}
%\put(590,118){\sx{2}{\rot{-15}{$y\!=\!\mathrm{Bell}(t)$}\ero}}
%\put(590,92){\sx{2}{\rot{-15}{$y\!=\!\mathrm{Gauss}(t)$}\ero}}
%\put(590,63){\sx{2}{\rot{-15}{$y\!=\!\mathrm{Dex}(t)$}\ero}}
%\put(546,70){\sx{2}{\rot{-42}{$y\!=\!\mathrm{Q}(t)$}\ero}}
%\put(512,80){\sx{2}{\rot{-48}{$y\!=\!\mathrm{Cu}(t)$}\ero}}
%\put(492,84){\sx{2}{\rot{-64}{$y\!=\!\mathrm{Ed}(t)$}\ero}}
%\put(450,116){\sx{2}{\rot{-72}{$y\!=\!\mathrm{Elli}(x)$}\ero}}
\put(477,124){\sx{2}{\rot{0}{$y\!=\!\mathrm{Fit}(x)$}\ero}}
\put(488,84){\sx{2}{\rot{0}{$y\!=\!\mathrm{Ellipse}(x)$}\ero}}
%\put(446,100){\sx{2}{\rot{-64}{Ellipse}\ero}}
\end{picture}
\end{document}
References
http://novayagazeta.livejournal.com/2664125.html Курсы валют превысили недельные максимумы. Dec. 29th, 2014 at 11:41 AM. В понедельник валютные торги начались с резкого ослабления рубля. По состоянию на 10:10 по московскому времени доллар вырос на 2,19 руб., достигнув отметки 56,19 руб. Курс евро к рублю вырос на 2,55 и составляет 68,55 руб. Уже к 10:25 курс евро поднялся выше 70 рублей, а курс доллара приблизился к 58, после чего курсы немного отступили. По состоянию на 10:40 курс доллара вернулся к отметке 57,5 руб., евро — к 70.
File history
Click on a date/time to view the file as it appeared at that time.
| Date/Time | Thumbnail | Dimensions | User | Comment | |
|---|---|---|---|---|---|
| current | 06:09, 1 December 2018 | 1,502 × 610 (142 KB) | Maintenance script (talk | contribs) | Importing image file |
- You cannot overwrite this file.
File usage
There are no pages that link to this file.