File:2014.12.31rudo.png
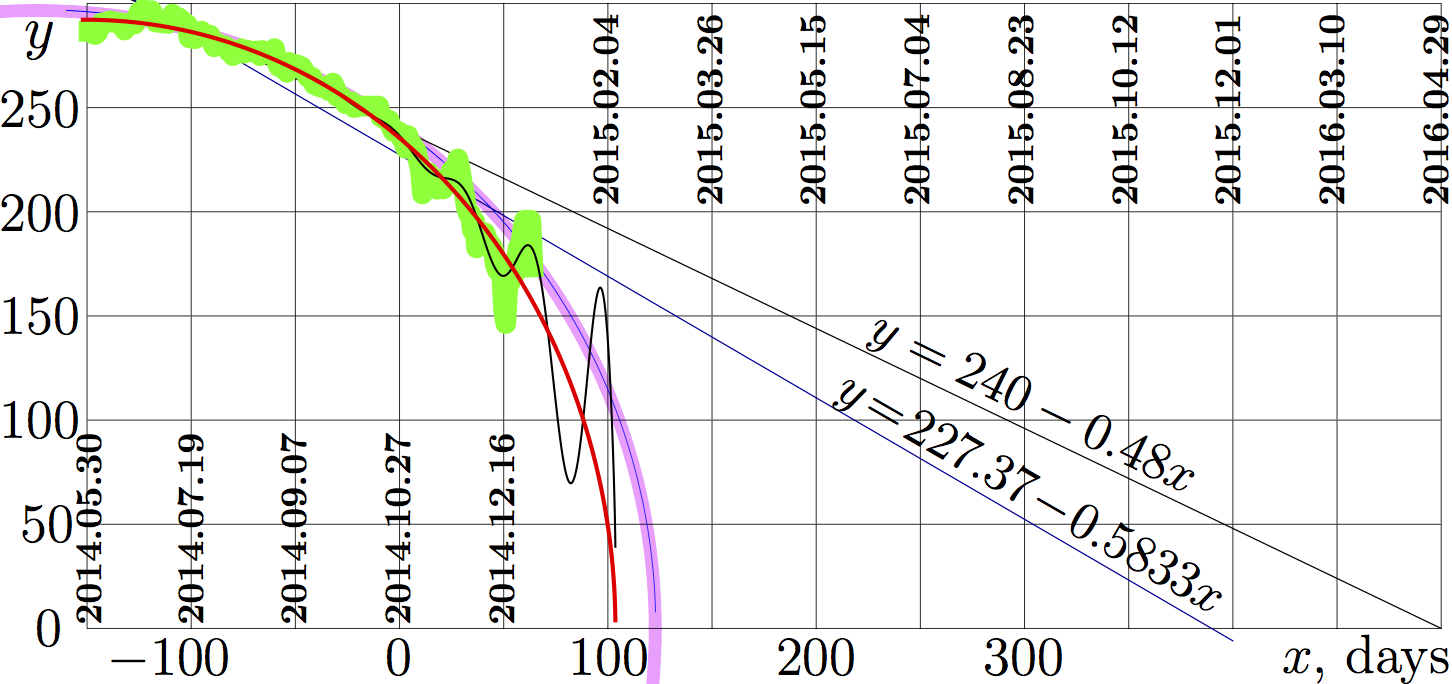
Value of 100 russian roubles, measured in the USA cents, $y$, versus time $x$, measured in days since the beginning of the project (2014.10.27).
Contents
Experimental data
The thick green curve represents the experimental data by https://www.mataf.net/en/currency/converter-USD-RUB
Linear approximations
The thin straight lines show the two linear approximations:
$y=240-0.48x ~$ , made 2014.10.27. With this fit, the project begun.
The first loaded image with this fit is http://mizugadro.mydns.jp/t/images/archive/c/ca/20141031085457%21Rusa2014.10.28t.jpg
$y=227.37-0.5833x ~$ , made 2014.12.30.
Pink circle
The thick ping arc covers the approximation
$y=\sqrt{(123-x)(471+x)}$ , made 2014.10.29.
At the scale of the graphic used, this function appears as just part of the round circle. Primary, this approximation had been used 29 November 2014 as http://mizugadro.mydns.jp/t/index.php/File:RubleArc.png
Red Ellipse
The thin red curve represents the ellipse:
$y=f(x)=1.14958\sqrt{(103.623 -x)(404.691 +x)}$
It can be interpreted as small deformation of the pink circle. The idea of this deformation comes from the observation, that quantities shown in the axes, have different dimensions. It is only occasional choice of scale of the graphic makes the "pink" approximation to look as a round circle.
Similar ellipses are shown also in figures
http://mizugadro.mydns.jp/t/index.php/File:Roublellip.png , loaded 03:59, 11 December 2014, and
http://mizugadro.mydns.jp/t/index.php/File:2014ruble15t.png , loaded 04:38, 15 December 2014
Black oscillating curve
The black oscillating curve represents the improved approximation:
$y=g(z)=f(z)+ 2 \exp(0.04 x) \sin\!\big(0.184882(-54.157 + x)\big) $
While the measurements are loaded at coordinates $x_n$ for $n=1..N$, and the corresponding values are saved as $y_n$, the mean deviation $D$ and the mean square deviation $Q$ for this approximation are expressed as follows:
$\displaystyle D ~ = ~ \frac{1}{N} ~ \sum_{n=1}^{N} ~ \left| g(x_n)-y_n \right| ~ \approx 3.4$
$\displaystyle Q= \sqrt{\frac{1}{N} \sum_{n=1}^{N} \big(g(x_n)-y_n\big)^2 } \approx 4.7$
The deviations are two orders of magnitude smaller, that the length of the range of variation of the function. I was not successful to construct other similar approximation with better precision (smaller deviations). In this sense the approximation $g$ about is exceptional among other approximations.
Deviations $D$ and $Q$ are small. The agreement of the approximation $g$ with the experimental data is unexpectedly good.
Question about the physical meaning of this fit are of scientific interest:
Why the 7-parametric fit $g$ covers the $N\!=\!214$ experimental dots with two significant figures?
What physical, economical model could provide such an approximation?
Interpretation
All the fits, except the first linear approximation, can be interpreted as indication to the crash of the Russian financial system in year 2015; that may mean the change to the manual regime of handling of the economics, similar to that of the USSR, then, the concept of measurement of value of rouble in the USA dollars losses its simple meaning.
One may expect, in the beginning of year 2015, the value of rouble will show strong oscillations, fluctuations; perhaps, irregular, that cannot be caught by the oscillating part of git $g$ above. Similar fluctuations are described in the laser physics (at the approaching the threshold of generation) and in medicine (Cheyne–Stokes respiration).
References
https://www.youtube.com/watch?v=JlHm_246emM
Вот за это и пзидят журнализдов Лайфньюс. Published on Nov 27, 2014. В.Путин. Упала стоимость рубля, ..
http://moshekam.livejournal.com/1138767.html Жребий наш измерен.... Nov. 29th, 2014 at 12:44 PM. Конечно, не по дуге, и не по прямой, а как всякий затухающий процесс будет изменяться по экспоненте. Поленился нарисовать аккуратно (красная линия моя), но где-то примерно так. Нуля, конечно не достигнет, но уровня, когда "за рубль будут давать в морду" (с) достигнет. И скоро.
http://mizugadro.mydns.jp/PAPERS/2015ruble.pdf D.Kouznetsov. Fitting of economical data with elementary functions: rouble versus dollar in 2014. In preparation, 2015.
Generators
File history
Click on a date/time to view the file as it appeared at that time.
| Date/Time | Thumbnail | Dimensions | User | Comment | |
|---|---|---|---|---|---|
| current | 06:09, 1 December 2018 | | 1,452 × 684 (190 KB) | Maintenance script (talk | contribs) | Importing image file |
- You cannot overwrite this file.
File usage
There are no pages that link to this file.