File:2021.12.05.wdc.png

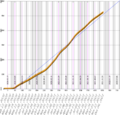
Comparison of data by ourworldindata
[1]
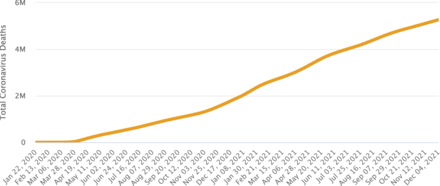
about worldwide death tall from Covid versus time \(T\) measured in days since 2020.02.15.
The screenshot of the graphic by Worldometer
[2]
for 2021.12.05 is shown in figure at right; this plot is used as background,
as the Worldometer does not provide any easy way to get the table of data presented in the picture.
The screenshot from Worldometer is a little bit squeezed in order to fit the universal scale used by the SVG pictures (that is essential for the comparison by the overlapping).
The black line shows data by [1].
The reasonable agreement between the Worldometer and the
Ourworldindata is seen; the relative deviation is or order of one percent and rougly corresponst to the thickness of the yellow line.
The blue line shows the linear approximation with increment 8400 per day.
Generation
Figure ![]() should be loaded in order to use the codes below.
should be loaded in order to use the codes below.
The initial data are loaded with code
<?php
$page = file_get_contents("https://covid.ourworldindata.org/data/owid-covid-data.csv");
file_put_contents("owid-covid-data.csv", $page);
?>
The worldwide death tall is extracted with command
grep World owid-covid-data.csv |cut -d, -f 3,4,8 > WorldDeath.txt
Then, the picture is generated with code
<!DOCTRINE html><html><body><small><small>
<?php
$j0=juliantojd(2, 15, 2020);
for($t=-24;$t<1001;$t++) $P[$t]=0;

$myfile = fopen("WorldDeath.txt", "r") or die("Unable to open file!");
for($i=0;$i<1001;$i++)
{
$g=fgets($myfile);
$h=explode(",",trim($g));
$s=count($h); if($s<2) break;
$s=strlen($h[2]);
$f=explode("-",$h[1]); $j=juliantojd($f[1], $f[2], $f[0]);
if($s>1){       $t=$j-$j0; // echo "$h[1] $t $h[2] ";
                $u=sscanf($h[2],"%d"); $v=$u[0];
                // echo $v,"<br>\n";
                $P[$t]=$v;  //echo "$i $t $P[$t]<br>\n";
        }
}
fclose($myfile);
$T=$t; echo "Total tall for T=$T days<br>";
//for($t=-24;$t<$T;$t++) { echo "$t,$P[$t]<br>" ;}

echo "<svg width='880'; height='800';>";
echo "<image x='-32' y='10' preserveAspectRatio='none' width='744' height='796' xlink:href='2021.12.05.wd.png'/>";
$L=52;
$B=620;
$j0=juliantojd(2, 15, 2020);
for($y=0;$y<601;$y+=50) { $x1=$L; $x2=$L+800; $Y=$B-$y;
echo "<line x1=$x1 y1=$Y x2=$x2 y2=$Y stroke='black' stroke-width='.5'/>\n";}

$y=600; $Y=$B+4-$y; echo "<text transform='translate(10,$Y)'>6M </text> \n";
$y=500; $Y=$B+4-$y; echo "<text transform='translate(10,$Y)'>5M </text> \n";
$y=400; $Y=$B+4-$y; echo "<text transform='translate(10,$Y)'>4M </text> \n";
$y=300; $Y=$B+4-$y; echo "<text transform='translate(10,$Y)'>3M </text> \n";
$y=200; $Y=$B+4-$y; echo "<text transform='translate(10,$Y)'>2M </text> \n";
$y=100; $Y=$B+4-$y; echo "<text transform='translate(10,$Y)'>1M </text> \n";
$y=0  ; $Y=$B+4-$y; echo "<text text-anchor='end' transform='translate(30,$Y)'>   0 </text> \n";

for($t=0;$t<801;$t+=10){$X=$L+$t; $Y1=$B; $Y2=$B-600;
 echo "<line x1=$X y1=$Y1 x2=$X y2=$Y2 stroke='black' stroke-width='.5'/>\n"; }

$B4=$B+4;
for($t=0;$t<801;$t+=50)
{
 $X=$L+$t;
 $Xm=$X-1;
 $Xp=$X+1;
 $X5=$X+5;
 $j=$j0+$t;
$d0=jdtojulian($j);
$d1=explode("/",$d0);
$text=sprintf("%04d.%02d.%02d",$d1[2],$d1[0],$d1[1]);
$tex=sprintf("%d",$t);
echo "<line x1=$X y1=30 x2=$X y2=$B4 stroke='RGB(255,0,255)' stroke-width='.8' />\n";
echo "<text text-anchor='middle' transform='translate($X5,560) rotate(-90)'>$text</text> \n";
echo "<text text-anchor='middle' transform='translate($Xp,634)'>$tex</text> \n";
}

echo "<polyline points='\n";

for($t=-24;$t<$T;$t++)
{
$X=$L+$t;
$Y=$B - 0.0001 * $P[$t];
echo "$X,$Y ";
}

echo "'";
echo " style='fill:none;stroke:#000;stroke-width:2' /> \n";

$X1=$L+ 50; $Y1=$B ;
$X2=$L+800; $Y2=$B-.0001*750*8400;
echo "<line x1=$X1 y1=$Y1 x2=$X2 y2=$Y2 stroke='blue' stroke-width='1'/>\n";

echo "</svg>";
?>
</body>
</html>
The generated picture picture is converted to png format, in order to allow the loading into wiki with standard way.
Historic context
Since year 2020, the total death tall due to Covid pandemic grows mainly linearly with increment 8400/day.
To the end of year 2021, Russia becomes the most important contributor to the total death rate, providing more than a thousands lethal cases daily.
If such a growth continues, within 20 years, the total death tall should become of order of 60 millions. That time, the linear approximation should already become invalid.
References
- ↑ 1.0 1.1 https://covid.ourworldindata.org/data/owid-covid-data.csv 2021.12.05
- ↑ https://www.worldometers.info/coronavirus/worldwide-graphs/#total-deaths Last updated: December 05, 2021, 04:46 GMT Coronavirus Worldwide Graphs Total Coronavirus Deaths Total Deaths (Linear Scale
File history
Click on a date/time to view the file as it appeared at that time.
| Date/Time | Thumbnail | Dimensions | User | Comment | |
|---|---|---|---|---|---|
| current | 15:46, 5 December 2021 |  | 1,030 × 984 (209 KB) | T (talk | contribs) |
- You cannot overwrite this file.
File usage
There are no pages that link to this file.
