File:2021.12.07.CovidRussiaForecast.png

Summary
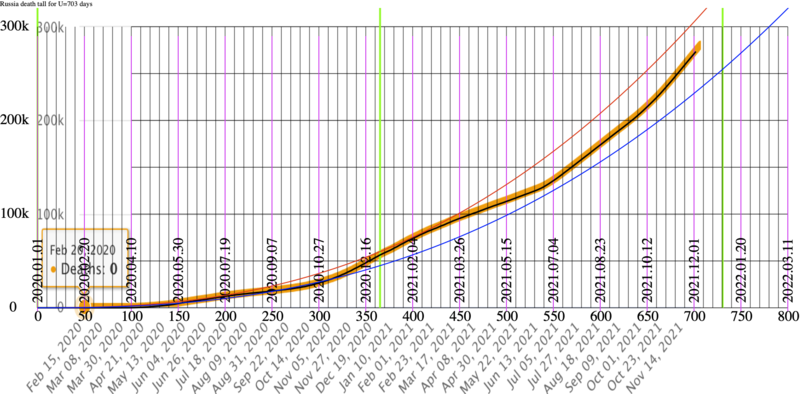
Covid death tall in Russia versus time measured in days since 2021.01.01
reported by Worldometer
[1]
(orange strip)
and by ourworldindata [2] (black curve).
The red and blue curves show the pessimistic and optimistic extrapolation with power functions
\( f(t)= c t^{5/2} \),
where \(t\) is time since 2020.01.01, measured in years (assuming that one year is 365.25 days),
\(f(t)\) is estimate of the total Covid death tall reported by Worldometer and ourworldindata,
and values of coefficient \( c \) are 60000 and 45000.

Generation
Worldometer does not provide any easy way for the automatic extraction of data presented. The data by Worldometer are presented as screenshot from 2021.12.06; this screenshot is shown in figure at right. It should be saved as 2021.12.06.CovidRussiaWd.png
Data by Ourwordindata are plotted on that screenshot with code below:
<!DOCTRINE html><html><body><small><small><small><small>
<?php
$j0=juliantojd(1, 1, 2020);
for($T=0;$T<1001;$T++) $P[$T]=0;

$myfile = fopen("Russia.txt", "r") or die("Unable to open file!");
for($i=0;$i<1001;$i++){ $g=fgets($myfile);
                        $h=explode(",",trim($g));
                        $s=count($h); if($s<2) break;
                        $s=strlen($h[2]);
                        $f=explode("-",$h[1]);
                        $j=juliantojd($f[1], $f[2], $f[0]);
                        if($s>1){ $T=$j-$j0; // echo "$h[1] $t $h[2] ";
                                  $u=sscanf($h[2],"%d"); $v=$u[0];    // echo $v,"<br>\n";
                                  $P[$T]=$v; }
                }
fclose($myfile);
$U=$T+1; echo "Russia death tall for U=$U days<br>";   //  for($T=0;$T<$U;$T++) { echo "$T,$P[$T] <br>" ;}

echo "<svg width='852'; height='500';>";
#echo "<image x='26' y='10' preserveAspectRatio='none' width='730' height='424' xlink:href='2021.12.06.CovidRussiaWd.png'/>";
echo "<image x='27' y='10' preserveAspectRatio='none' width='728' height='420' xlink:href='2021.12.06.CovidRussiaWd.png'/>";
$L=40;
$B=320;
for($y=0;$y<301;$y+=50){$x1=$L+100; $x2=$L+800; $Y=$B-$y;
                        echo "<line x1=$x1 y1=$Y x2=$x2 y2=$Y stroke='black' stroke-width='.6'/>\n";}

$y=300; $Y=$B+4-$y; echo "<text transform='translate(0,$Y)'>300k </text> \n";
$y=200; $Y=$B+4-$y; echo "<text transform='translate(0,$Y)'>200k </text> \n";
$y=100; $Y=$B+4-$y; echo "<text transform='translate(0,$Y)'>100k </text> \n";
$y=0  ; $Y=$B+4-$y; echo "<text text-anchor='end' transform='translate(18,$Y)'> 0 </text> \n";

for($t=0;$t<4;$t++){    $T=365.25*$t; $X=$L+$T;
                        echo "<line x1=$X y1=$B x2=$X y2=0 stroke='RGB(0,255,0)' stroke-width='2'/>\n"; }

for($T=0;$T<801;$T+=10){$X=$L+$T; $Y1=$B; $Y2=$B-300;
 echo "<line x1=$X y1=$Y1 x2=$X y2=$Y2 stroke='black' stroke-width='.5'/>\n"; }

$B4=$B+4;
for($T=0;$T<801;$T+=50){$X=$L+$T;
                        $X1=$L+$T+1;
                        $Xp=$X+5;
                        $j=$j0+$T;
                        $d0=jdtojulian($j);
                        $d1=explode("/",$d0);
                        $text=sprintf("%04d.%02d.%02d",$d1[2],$d1[0],$d1[1]);
                        $tex=sprintf("%d",$T);
                        $B1=$B-40;
                        $B2=$B+14;
                        echo "<line x1=$X y1=30 x2=$X y2=$B4 stroke='RGB(255,0,255)' stroke-width='.9' />\n";
                        echo "<text text-anchor='middle' transform='translate($Xp,$B1) rotate(-90)'>$text</text> \n";
                        echo "<text text-anchor='middle' transform='translate($X1,$B2)'>$tex</text> \n"; }

echo "<polyline points='\n";
for($T=0;$T<$U;$T++) {  $X=$L+$T;
                        $Y=$B - 0.001 * $P[$T];
                        echo "$X,$Y "; }
echo "'"; echo " style='fill:none;stroke:#000;stroke-width:1.6' /> \n";

echo "<polyline points='\n";
for($T=0;$T<811;$T++) { $X=$L+$T;
                        $t=$T/365.25;
                        $Y=$B - 0.001 *60000*$t*$t*sqrt($t);
                        echo "$X,$Y "; }
echo "'"; echo " style='fill:none;stroke:#f00;stroke-width:1' /> \n";

echo "<polyline points='\n";
for($T=0;$T<811;$T++) { $X=$L+$T;
                        $t=$T/365.25;
                        $Y=$B - 0.001 *45000*$t*$t*sqrt($t);
                        echo "$X,$Y "; }
echo "'"; echo " style='fill:none;stroke:#00f;stroke-width:1' /> \n";

echo "</svg>";
echo "</small>\n";
?>
</body></html>
References
- ↑ https://www.worldometers.info/coronavirus/country/russia/ World / Countries / Russia Last updated: December 06, 2021, 11:05 GMT .. Total Coronavirus Deaths in Russia
- ↑ https://covid.ourworldindata.org/data/owid-covid-data.csv downloaded 2021.12.05
File history
Click on a date/time to view the file as it appeared at that time.
| Date/Time | Thumbnail | Dimensions | User | Comment | |
|---|---|---|---|---|---|
| current | 11:21, 7 December 2021 | | 1,706 × 841 (314 KB) | T (talk | contribs) | <div style="margin:0px -14px 0px -200px; background-color:#fff"> <div style="margin:0px 0px 0px 30px; line-height:1.2em"> Covid death tall in Russia versus time measured in days since 2021.01.01 reported by Worldometer <ref name="w"> https://w... |
- You cannot overwrite this file.
File usage
There are no pages that link to this file.