File:Acosc1plotT.png

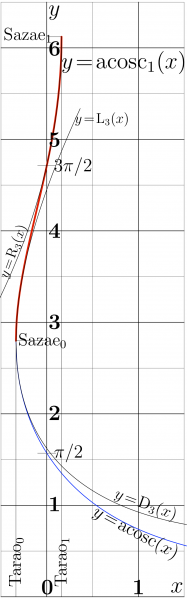
Plot of Acosc1, which is first branch of inverse function of cosc$(x)=\cos(x)/x$.
Description
- $y=\text{acosc}_1(x)$ is shown with thick red line.
The two asymptotics are shown with thin lines:
- $\displaystyle y= \mathrm R_3(x) =
\mathrm{Sazae}_1 - \sqrt{ \frac{2}{\mathrm{Tarao}_1 } (\mathrm{Tarao}_1\!-\!x) } + \frac{2\, (\mathrm{Tarao}_1 \!-\! x )}{3~ \mathrm{Sazae}_1~ \mathrm{Tarao}_1}$
which approximates the function in vicinity of $\mathrm{Tarao}_1$, and
- $\displaystyle y= \mathrm L_3(x) =
\mathrm{Sazae}_0 + \sqrt{ \frac{-2}{\mathrm{Tarao}_0} (x-\mathrm{Tarao}_0) } - \frac {2\, (x\!-\!\mathrm{Tarao}_0)} {3~ \mathrm{Tarao}_0 ~ \mathrm{Sazae}_0} $ which aprocimates the function in vicinity of Tarao$=\mathrm{Tarao}_0$. These asymptotics are used in the numerical implementation acosc1 available at acosc1.cin.
At the bottom part of the figure, function ArcCosc=acosc is also plotted and compared to its approximation
- $\displaystyle y=\mathrm D_3 (x)=
\mathrm{Sazae}_0 - \sqrt{ \frac{-2}{\mathrm{Tarao}_0} (x-\mathrm{Tarao}_0) } - \frac {2\, (x\!-\!\mathrm{Tarao}_0)} {3~ \mathrm{Tarao}_0 ~ \mathrm{Sazae}_0} $
Constants Sazae are positive solutions $x$ of equation $\text{cosc}'(x)=0$ .
Constants Tarao are defined with
- $\mathrm{Tarao}_n=\mathrm{cosc}(\mathrm{Sazae}_n)$
In particular,
- $\!\!\! \mathrm{Sazae}_0=~$Sazae$~ \approx 2.798386045783887~~$, $
~~\mathrm{Tarao}_0=~$Tarao$~\approx\! −0.33650841691839534 $
- $\!\!\! \mathrm{Sazae}_1=~$Sazae$_1\!\approx 6.1212504668980685~$, $
~~\mathrm{Tarao}_1\!=~$Tarao$_1\!\approx 0.161228034325064 $
C++ generator of curves
// Files ado.cin and acosc1.cin should be loaded to the working directory in order to compile the C++ code below:
#include <math.h>
#include <stdio.h>
#include <stdlib.h>
#define DB double
#define DO(x,y) for(x=0;x<y;x++)
using namespace std;
#include <complex>
typedef complex<double> z_type;
#define Re(x) x.real()
#define Im(x) x.imag()
#define I z_type(0.,1.)
#include "ado.cin"
#include "acosc1.cin"
#define M(x,y) fprintf(o,"%6.4f %6.4f M\n",0.+x,0.+y);
#define L(x,y) fprintf(o,"%6.4f %6.4f L\n",0.+x,0.+y);
#define S(x,y) fprintf(o,"S\n",);
main(){ int j,k,m,n; DB x,y, p,q, t; z_type z,c,d;
DB Sazae= 2.798386045783887; // H
DB Tarao= -0.33650841691839534; // J
FILE *o;o=fopen("acosc1plot.eps","w");ado(o,230,670);
fprintf(o,"60 10 translate\n 100 100 scale\n");
for(m=0;m<2;m++){M(m,0)L(m,6.5)}
for(n=0;n<7;n++){M(-.5,n)L(1.5,n)}
fprintf(o,"2 setlinecap .006 W 0 0 0 RGB S\n");
for(m=-1;m<2;m++){M(.5+m,0)L(.5+m,6.5)}
for(n=0;n<7;n++){M(-.5,n+.5)L(1.5,n+.5)}
fprintf(o,"2 setlinecap .002 W 0 0 0 RGB S\n");
fprintf(o,"2 setlinecap 1 setlinejoin \n");
//
/* M(Tarao,Sazae)  DO(m,200){x=-.33+.01*(m+.5); z=x; DB t=x-Tarao0, u=sqrt(t);
 y=Sazae + u*(2.437906425896532+t*0.50093301330428)
         + t*(0.707954233164988+t*0.57144599327344); L(x,y);} fprintf(o,".06 W 0 1 0 RGB S\n");
*/
//
M(Tarao0,Sazae0) DO(m,200){x=Tarao+(Tarao1-Tarao)*.02*(m+.5); y=Re(acosc(x)); L(x,y) }
fprintf(o,"1 setlinejoin 1 setlinecap .007 W 0 0 1 RGB S\n");
//
M(Tarao0,Sazae0) DO(m,100){x=Tarao+(Tarao1-Tarao)*.01*(m+.5); y=Re(acosc1(x)); L(x,y) }
L(Tarao1, Sazae1)
fprintf(o,"1 setlinejoin 1 setlinecap .02 W 1 0 0 RGB S\n");
//
M(Tarao,Sazae)
DO(m,70){x=-.33+.01*(m+.5); z=x;
 y=Sazae + sqrt((-2./Tarao)*(x-Tarao)) - 2./(3.*Sazae*Tarao)*(x-Tarao)  ;   L(x,y);}
 fprintf(o,".005 W 0 0 0 RGB S\n");
//
M(Tarao,Sazae)
DO(m,200){x=-.33+.01*(m+.5); z=x;
 y=Sazae - sqrt((-2./Tarao)*(x-Tarao)) - 2./(3.*Sazae*Tarao)*(x-Tarao)  ;   L(x,y);}
 fprintf(o,".005 W 0 0 0 RGB S\n");
//
M(Tarao1,Sazae1)
DO(m,70){x=Tarao1-.01*(m+.5); DB t=Tarao1-x; DB u=sqrt((2./Tarao1)*t);
y=Sazae1 - u + 1./3./Sazae1 * t; L(x,y)}
 fprintf(o,".005 W 0 0 0 RGB S\n");
//
M(-.1,3.*M_PI/2) L(.1,3.*M_PI/2)
M(-.1,M_PI/2)L(.1,M_PI/2)
M(Tarao,0)L(Tarao,Sazae)L(0,Sazae)
M(Tarao1,0)L(Tarao1,Sazae1)L(0,Sazae1)
fprintf(o,"2 setlinecap .003 W 0 0 0 RGB S\n");
//
fprintf(o,"showpage\n%c%cTrailer",'%','%'); fclose(o);
     system("epstopdf acosc1plot.eps");
     system(    "open acosc1plot.pdf");
     getchar(); system("killall Preview");//for mac
}
Latex generator of labels
% File acosc1plot.pdf ahould be generated with the code above on order to compile the Latex document below:
%<br> \documentclass[12pt]{article} %<br> \paperheight 838px %<br> \paperwidth 844px %<br> \textwidth 1294px %<br> \textheight 1200px %<br> \topmargin -80px %<br> \oddsidemargin -80px %<br> \usepackage{graphics} %<br> \usepackage{rotating} %<br> \newcommand \sx {\scalebox} %<br> \newcommand \rot {\begin{rotate}} %<br> \newcommand \ero {\end{rotate}} %<br> \newcommand \ing {\includegraphics} %<br> \newcommand \rmi {\mathrm{i}} %<br> \begin{document} %<br> \newcommand \zoomax { %<br> \put(16,820){\sx{4.4}{$y$}} %<br> \put(16,630){\sx{4}{$2$}} %<br> \put(16,430){\sx{4}{$0$}} %<br> \put(-4, 230){\sx{4}{$-\!2$}} %<br> \put(220, 5){\sx{4}{$-\!2$}} %<br> \put(443, 5){\sx{4}{$0$}} %<br> \put(643, 5){\sx{4}{$2$}} %<br> \put(831,6){\sx{4}{$x$}} %<br> } %<br> \parindent 0pt %<br> %\sx{8}{\begin{picture}(86,86) \put(0,0){\ing{b271t0}} %<br> \begin{picture}(816,816) %<br> \put(40,30){\sx{10}{\ing{1h}}} %<br> \put(40,30){\sx{10}{\ing{1b}}} %<br> \zoomax %<br> \end{picture} %<br> \end{document} %<br> %
File history
Click on a date/time to view the file as it appeared at that time.
| Date/Time | Thumbnail | Dimensions | User | Comment | |
|---|---|---|---|---|---|
| current | 17:50, 20 June 2013 | 851 × 2,728 (203 KB) | Maintenance script (talk | contribs) | Importing image file |
- You cannot overwrite this file.
File usage
The following page links to this file: