File:2013.09.13.odakura.jpg
Size of this preview: 800 × 493 pixels. Other resolutions: 320 × 197 pixels | 1,545 × 953 pixels.
Original file (1,545 × 953 pixels, file size: 547 KB, MIME type: image/jpeg)
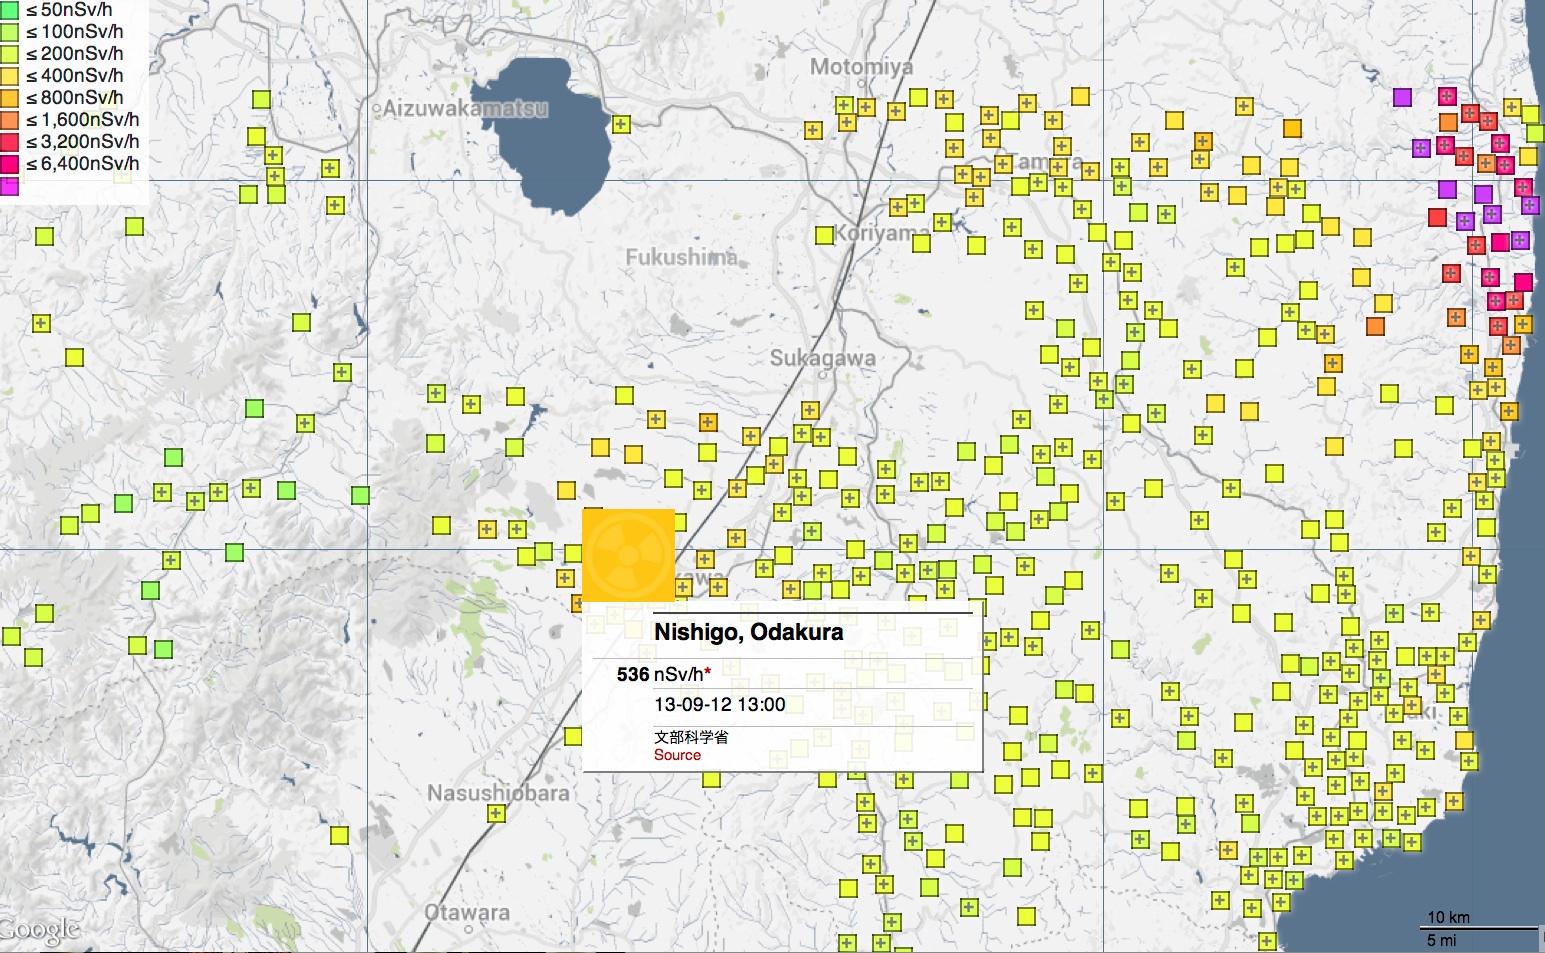
Snapshot of the map of contamination [1] for 2013.09.13 for Nishigo, Odakura suggests 536nSv/h. It is about of 100 kilometers away from the Fukushima nuclear plant, and it is more than 10 times higher than the normal background radiation level.
In other areas (at the similar separation from the Fukushima Nuclear plant, the radiation is lower. The map indicates the highly inhomogeneous distribution of unstable isotopes at the fallout from the exploded nuclear reactors.
References
- ↑ http://jciv.iidj.net/map/ Japan Radiation map, 2013.09.13
File history
Click on a date/time to view the file as it appeared at that time.
| Date/Time | Thumbnail | Dimensions | User | Comment | |
|---|---|---|---|---|---|
| current | 13:50, 12 September 2013 | | 1,545 × 953 (547 KB) | T (talk | contribs) | Snapshot of the map of contamination <ref>http://jciv.iidj.net/map/ Japan Radiation map, 2013.09.13</ref> for 2013.09.13 for Nishigo, Odakura suggests 536nSv/h. It is about of 100 kilometers away from the Fukushima nuclear plant, and it is more tha... |
- You cannot overwrite this file.
File usage
There are no pages that link to this file.