File:2020.03.03fit13t.png

Daily cases of Coronavirus excluding mainland China, data to 2020.03.03 by worldometers [1].
Then, errorbars for 2020.03.04 and 2020.03.05 are added. They match the oddest blue curve.
The original data are detected to vary a little bit. Hope, this is correction of errors, not a fraud. The corrections of the previous dates are not taken into account in this plot.
Contents
Description
Let \(n=n(t)\) be number of daily new cases or coronavirus refistered outside of China mainland. This set of data is chosen because the communist ideology of the China administration not only allow misinformation, but proscribe to use it for the propagandistic goals (to show advantages of China and, in general, that of the communistic regime).
Assuming the independent (Poisson) statistics of cases, the statistical deviation of data \(n\) from some trend is supposed to be of order of \(\sqrt{n}\). However, if I plot \(\sqrt{n}\) instead of \(n\), then, the random errors of characterization of spread of the coronavirus is the same for all data; it is of order of unity.
The discrete parameter \(t\) is just number of day since the beginning of alarm and observation. For the analysis, I assume, that 9 cases are registered at the first day of observations, id est, 2020.01.22.
Each datum is represented with green bar; its size corresponds to the typical statistical deviation of the measured number from the general trend. The goal is to choose this trend and use it as forecast, prediction.
The 3-parametric fits happen to be sufficient to be close enough to the experimental bars. The 3 fits are shown with solid line:
\(f_{40}(t) = 3.77461 + 0.097491 \exp(0.149631 t) \phantom{123}\) (red)
\(f_{41}(t) = 3.41545 + 0.163869 \exp(0.135286 t) \phantom{123}\) (black)
\(f_{35}(t) = 3.23360 + 0.252783 \exp(0.120411 t) \phantom{123}\) (blue)
The number of daily new cases is approximated as
\( n(t)\approx f_m(t)^2\)
Approximation \( f_{35}\) is optimistic. It is constructed to fit the first 35 experimental data, among them, the last dot drops a little bit down from the general heap.
Approximation \( f_{40}\) is pessimistic. It is constructed to fit the first 40 experimental data, among them, the last 4 dots jump a little bit above the general heap.
Approximation \( f_{41}\) is some intermedate. It is constructed to fit the first 41 experimental dots. It happens to fit well also the 42h dot too; so, no new approximation is constructed to take into the 42th datum.
The approximations gives the estimate of the increment of the rate of the new patients:
it is about of 0.27/day; roughly, each day, the number of daily new patients increases for \(\exp(0.27) \!\approx\! 1.3\) times ; for 2020.03.04, no tendency of slowing down of the spreading of the decease is seen from these data.
The generators of the curves are supplied below
Experimental data
The primary experimental data by worldometers [1] are copipasted below; they refer to year 2020:
1.22 9
1.23 6
1.24 15
1.25 10
1.26 16
1.27 10
1.28 18
1.29 18
1.30 29
1.31 28
2.01 14
2.02 13
2.03 4
2.04 31
2.05 27
2.06 30
2.07 52
2.08 24
2.09 28
2.10 79
2.11 20
2.12 45
2.13 61
2.14 21
2.15 89
2.16 84
2.17 115
2.18 103
2.19 125
2.20 88
2.21 173
2.22 330
2.23 340
2.24 374
2.25 335
2.26 568
2.27 956
2.28 1085
2.29 1416
3.01 1775
3.02 1733
3.03 2454
3.04 2159
3.05 2966
3.06 3528
C++ generator of curves
#include<math.h>
#include<stdio.h>
#include<stdlib.h>
#define DB double
#define DO(x,y) for(x=0;x<y;x++)
int ado(FILE *O, int X, int Y)
{ fprintf(O,"%c!PS-Adobe-2.0 EPSF-2.0\n",'%');
fprintf(O,"%c%cBoundingBox: 0 0 %d %d\n",'%','%',X,Y);
fprintf(O,"/M {moveto} bind def\n");
fprintf(O,"/L {lineto} bind def\n");
fprintf(O,"/S {stroke} bind def\n");
fprintf(O,"/s {show newpath} bind def\n");
fprintf(O,"/C {closepath} bind def\n");
fprintf(O,"/F {fill} bind def\n");
fprintf(O,"/o {1 0 360 arc C F} bind def\n");
// fprintf(O,"/times-Roman-Bold findfont 20 scalefont setfont\n");
fprintf(O,"/Helvetica-Bold findfont 2 scalefont setfont\n");
fprintf(O,"/W {setlinewidth} bind def\n");
fprintf(O,"/RGB {setrgbcolor} bind def\n");
return 0;
}
double f35(double x){return 3.233596555073794 + 0.25278295790658345*exp(0.1204105367697047*x);}
double f40(double x){return 3.774610005387354 + 0.09749051738788238*exp(0.1496313645313525*x);}
double f41(double x){return 3.415452123434854 + 0.16386947166609223*exp(0.1352858211607943*x);}
int main(){ DB d,x,y,f,F,G,H; int j,m,n,K,S; FILE *i,*o;
o=fopen("13.eps","w");
ado(o,508,620);
#define M(x,y) fprintf(o,"%6.4f %6.4f M\n",0.+x,0.+y);
#define L(x,y) fprintf(o,"%6.4f %6.4f L\n",0.+x,0.+y);
#define o(x,y) fprintf(o,"%6.2f %6.2f o\n",0.+x,0.+y);
fprintf(o,"2 2 translate 10 10 scale\n");
DO(m,11){M(5*m,0)L(5*m,60)}
DO(n,7){M(0,10*n)L(50,10*n)}
fprintf(o,"0 0 0 RGB 2 setlinecap .1 W S\n");
for(m=0;m<51;m++){y=f40(m); if(m==0)M(m,y) else L(m,y); if(y>61) break ;}fprintf(o,"1 0 0 RGB 1 setlinecap .3 W S\n");
for(m=0;m<51;m++){y=f41(m); if(m==0)M(m,y) else L(m,y); if(y>61) break ;}fprintf(o,"0 0 0 RGB 1 setlinecap .3 W S\n");
for(m=0;m<51;m++){y=f35(m); if(m==0)M(m,y) else L(m,y); if(y>61) break ;}fprintf(o,"0 0 1 RGB 1 setlinecap .3 W S\n");
fprintf(o,"0 0 0 RGB \n");
i=fopen("daily.txt","r");
S=0;
for(m=1;m<199;m++){j=fscanf(i,"%lf%d",&d,&K); if(j<2) break;
S+=K;
F=f35(m);
G=f40(m);
H=f41(m);
printf("%2d %4.2lf %4d %6d %7.1lf %7.1lf %7.1lf\n",m,d,K,S,F*F,G*G,H*H);
M(m,sqrt(.01+K)-1.)
L(m,sqrt(.01+K)+1.)
if(m/5*5==m) { if(m<40) fprintf(o,"gsave %4.2f 45.5 translate 90 rotate 0 -6 M (2020.0%4.02f) show grestore\n",m-5.3,d);
else fprintf(o,"gsave %4.2f 15.5 translate 90 rotate 0 -6 M (2020.0%4.02f) show grestore\n",m-5.3,d);
}
}
fclose(i);
fprintf(o,"0 1 0 RGB 1 setlinecap .7 W S\n");
fprintf(o,"showpage\n%c%cTrailer",'%','%'); fclose(o);
system("epstopdf 13.eps");
system( "open 13.pdf");
}
Latex generator of labels
\documentclass[12pt]{article}
\usepackage{geometry}
\usepackage{graphicx}
\usepackage{rotating}
\usepackage{color}
%\definecolor{pink}{RGB}{255,127,255}
\paperwidth 540pt
\paperheight 644pt
\textwidth 800pt
\textheight 900pt
\topmargin -108pt
\oddsidemargin -72pt
\newcommand \ing {\includegraphics}
\newcommand \sx {\scalebox}
\newcommand \rot {\begin{rotate}}
\newcommand \ero {\end{rotate}}
\pagestyle{empty}
\begin{document}
\parindent 0pt
\begin{picture}(530,630)
\put(30,10){\ing{13.pdf}}
\put( 0,615){\sx{1.7}{$\sqrt{n}$}} \put(50,617){\sx{1.7}{$n$, number of new cases}}
\put(4,507){\sx{2}{50}} \put(33,507){\sx{1.7}{2500}}
\put(4,407){\sx{2}{40}} \put(33,407){\sx{1.7}{1600}}
\put(4,307){\sx{2}{30}} \put(33,307){\sx{1.7}{~900}}
\put(4,207){\sx{2}{20}} \put(33,207){\sx{1.7}{~400}}
\put(4,107){\sx{2}{10}} \put(33,107){\sx{1.7}{~100}}
\put(4,07){\sx{2}{~0}}
\put(26,-7){\sx{2}{0}}
\put(120,-7){\sx{2}{10}}
\put(221,-7){\sx{2}{20}}
\put(321,-7){\sx{2}{30}}
\put(421,-7){\sx{2}{40}}
\put(475,-7){\sx{2}{$t$,days}}
\put(430,470){\rot{84}\sx{2.9}{$\sqrt{n}\!=\!f_{40}(t)$}\ero}
\put(497,470){\rot{83}\sx{2.9}{$\sqrt{n}\!=\!f_{35}(t)$}\ero}
\end{picture}
\end{document}
References
- ↑ 1.0 1.1 https://www.worldometers.info/coronavirus/coronavirus-cases/ Outside of China 2020.03.03
File history
Click on a date/time to view the file as it appeared at that time.
| Date/Time | Thumbnail | Dimensions | User | Comment | |
|---|---|---|---|---|---|
| current | 10:30, 7 March 2020 | | 747 × 891 (100 KB) | T (talk | contribs) | update |
| 13:01, 6 March 2020 |  | 747 × 891 (98 KB) | T (talk | contribs) | update, one bar more | |
| 17:41, 5 March 2020 |  | 747 × 891 (98 KB) | T (talk | contribs) | add one more experimental dot from the same site | |
| 21:58, 4 March 2020 | 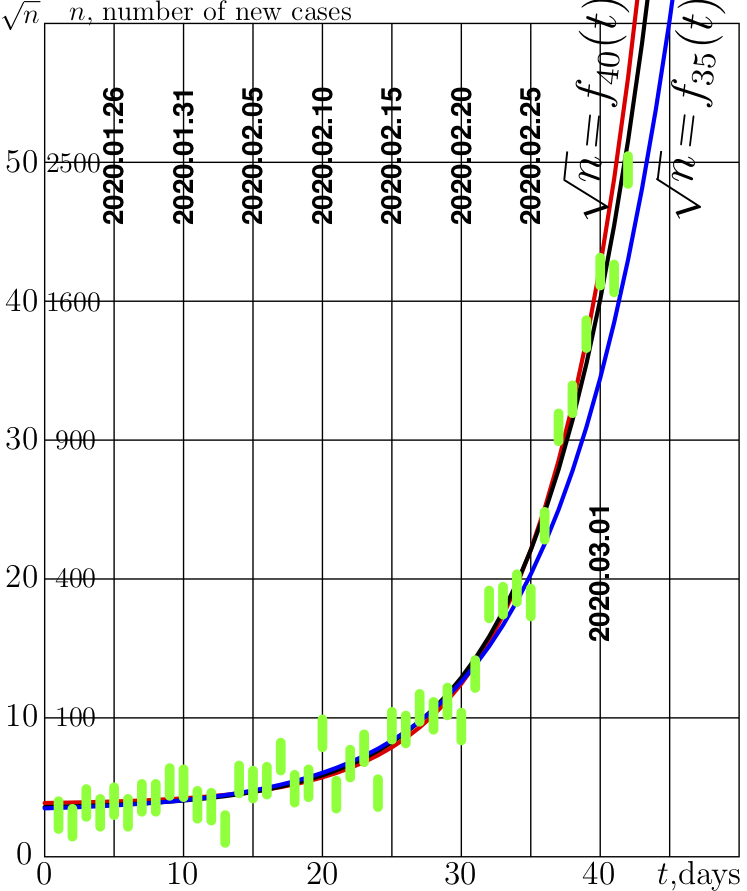 | 747 × 891 (98 KB) | T (talk | contribs) |
- You cannot overwrite this file.
File usage
The following page links to this file:
- File:13t.png (file redirect)