File:AcosplotT.png

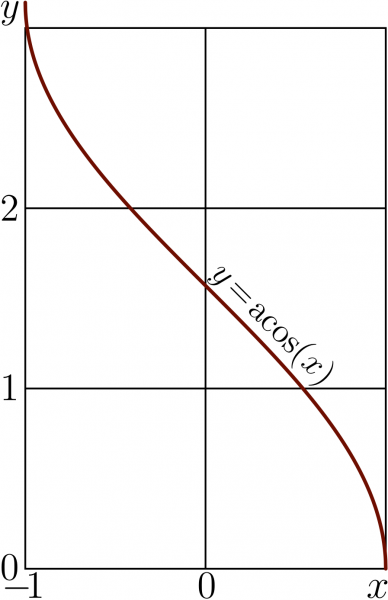
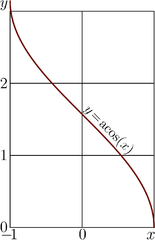
Explicit plot of function ArcCos.
- $y=\mathrm{acos}(x)$
is plotted versus $x$.
C++ generator of curve
File ado.cin should be loaded in the cuffent directory for the compilation of the C++ code below:
#include <math.h>
#include <stdio.h>
#include <stdlib.h>
#define DB double
#define DO(x,y) for(x=0;x<y;x++)
using namespace std;
#include <complex>
typedef complex<double> z_type;
#define Re(x) x.real()
#define Im(x) x.imag()
#define I z_type(0.,1.)
#include "ado.cin"
z_type acos(z_type z){
if(Im(z)<0){if(Re(z)>=0){return  I*log( z + sqrt(z*z-1.) );}
                    else{return  I*log( z - sqrt(z*z-1.) );}}
            if(Re(z)>=0){return -I*log( z + sqrt(z*z-1.) );}
                   else {return -I*log( z - sqrt(z*z-1.) );} }
#define M(x,y) fprintf(o,"%6.4f %6.4f M\n",0.+x,0.+y);
#define L(x,y) fprintf(o,"%6.4f %6.4f L\n",0.+x,0.+y);
#define S(x,y) fprintf(o,"S\n",);
main(){ int j,k,m,n; DB x,y, p,q, t; z_type z,c,d;
FILE *o;o=fopen("acosplot.eps","w");ado(o,220,330);
fprintf(o,"110 10 translate\n 100 100 scale\n");
for(m=-1;m<2;m++){M(m,0)L(m,3)}
for(n=0;n<4;n++){M(-1,n)L(1,n)}
fprintf(o,"2 setlinecap .01 W 0 0 0 RGB S\n");
DO(m,2001){ x=-1.+.001*m; z=x; y=Re(acos(z)); if(m==0)M(x,y) else L(x,y) }
fprintf(o,"1 setlinejoin 1 setlinecap .02 W .5 0 0 RGB S\n"); p=1.8;q=.7;
fprintf(o,"showpage\n%c%cTrailer",'%','%'); fclose(o);
      system("epstopdf acosplot.eps");
      system(    "open acosplot.pdf");
      getchar(); system("killall Preview");//for mac
}
Latex generator of labels
% Copyleft 2012 by Dmitrii Kouznetsov %<br> \documentclass[12pt]{article} %<br> \usepackage{geometry} %<br> \usepackage{graphicx} %<br> \usepackage{rotating} %<br> \paperwidth 432pt %<br> \paperheight 668pt %<br> \topmargin -90pt %<br> \oddsidemargin -80pt %<br> \textwidth 900pt %<br> \textheight 900pt %<br> \pagestyle {empty} %<br> \newcommand \sx {\scalebox} %<br> \newcommand \rot {\begin{rotate}} %<br> \newcommand \ero {\end{rotate}} %<br> \newcommand \ing {\includegraphics} %<br> \begin{document} %<br> \parindent 0pt \sx{2}{ \begin{picture}(220,323) %<br> \put(4,6){\ing{acosplot}} %<br> \put(0,323){\sx{1.8}{$y$}} %<br> %\put(2,309){\sx{1.8}{$3$}} %<br> \put(0,210){\sx{1.8}{$2$}} %<br> \put(0,110){\sx{1.8}{$1$}} %<br> \put(0, 10){\sx{1.8}{$0$}} %<br> \put(1, 0){\sx{1.8}{$-\!1$}} %<br> \put(110, 0){\sx{1.8}{$0$}} %<br> \put(204, 0){\sx{1.9}{$x$}} %<br> \put(117,180){\sx{1.6}{\rot{-45}$y\!=\!\mathrm{acos}(x)$\ero}} \end{picture} %<br> } %<br> \end{document}
Keywords
ArcCos, Inverse function, Explicit plot, Elementary function,,,
File history
Click on a date/time to view the file as it appeared at that time.
| Date/Time | Thumbnail | Dimensions | User | Comment | |
|---|---|---|---|---|---|
| current | 17:50, 20 June 2013 | | 897 × 1,387 (69 KB) | Maintenance script (talk | contribs) | Importing image file |
- You cannot overwrite this file.
File usage
The following page links to this file: