File:Ausinplot1.jpg
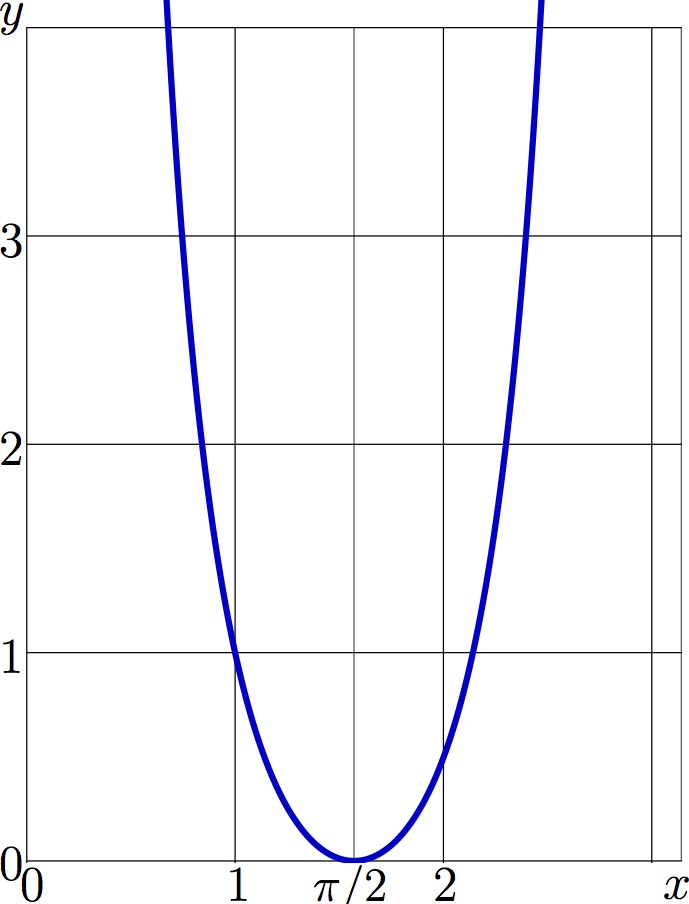
Explicit plot of function AuSin for real values of the argument.
$y=\mathrm{AuSin}(z)$
Additional grid lines $x\!=\!\pi/2$ and $x\!=\!\pi$ are drawn.
C++ generator of curves
Files ado.cin, arcsin.cin, susin.cin, ausin.cin should be loaded to the working directory
#include <math.h>
#include <stdio.h>
#include <stdlib.h>
#define DB double
#define DO(x,y) for(x=0;x<y;x++)
using namespace std;
#include<complex>
typedef complex<double> z_type;
#define Re(x) x.real()
#define Im(x) x.imag()
#define I z_type(0.,1.)
#include "ado.cin"
#include "arcsin.cin"
#include "susin.cin"
#include "ausin.cin"
int main(){ int j,k,m,n; DB x,y, p,q, t; z_type z,c,d;
FILE *o;o=fopen("ausinplo.eps","w"); ado(o,318,420);
#define M(x,y) {fprintf(o,"%6.4f %6.4f M\n",0.+x,0.+y);}
#define L(x,y) {fprintf(o,"%6.4f %6.4f L\n",0.+x,0.+y);}
fprintf(o,"1 1 translate\n 100 100 scale\n");
fprintf(o,"1 setlinejoin 2 setlinecap\n");
for(m=0;m<4;m++){M(m,-1) L(m,4) }
for(n=0;n<5;n++){M( 0,n) L(M_PI,n)}
fprintf(o,".006 W 0 0 0 RGB S\n");
M(M_PI/2.,0); L(M_PI/2.,4)
M(M_PI,0); L(M_PI,4)
fprintf(o,".004 W 0 0 0 RGB S\n");
fprintf(o,"1 setlinejoin 1 setlinecap\n");
DO(m,201){ x=M_PI/2.+.009*(m-100); z=z_type(x,1.e-8); c=ausin(z); y=Re(c); if(m==0)M(x,y) else L(x,y); printf("%8.5f %8.5f\n",x,y); }
fprintf(o,".03 W 0 0 .8 RGB S\n");
/*
DO(m,100){ x=.5+.1*m; y=sqrt(3./x); if(m==0) M(x,y) else L(x,y) ; if ( x>10.) break;}
fprintf(o,".01 W 0 0 0 RGB S\n");
//n=0;DO(m,100){ x=.1*m; z=z_type(x,1.e-8); c=susin(z); y=Im(c); if(y>-2 && y<3) { if(n==0) M(x,y) else L(x,y); n++;}}
//fprintf(o,".02 W .8 0 0 RGB S\n"); printf("n=%3d\n",n);
*/
fprintf(o,"showpage\n");
fprintf(o,"%c%cTrailer\n",'%','%');
fclose(o);
system("epstopdf ausinplo.eps");
system( "open ausinplo.pdf"); //for macintosh
getchar(); system("killall Preview"); // For macintosh
}
Latex generator of labels
\documentclass[12pt]{article}
\usepackage{geometry}
\usepackage{graphics}
\paperwidth 332pt
\paperheight 438pt
\topmargin -109pt
\oddsidemargin -90pt
\newcommand \sx {\scalebox}
\pagestyle{empty}
\begin{document}
\begin{picture}(320,432)
\put(14,16){\includegraphics{ausinplo}}
\put(1,420){\sx{2.2}{$y$}}
%\put(-1,151){\sx{2.8}{$\frac{\pi}{2}$}}
\put(0,308){\sx{2.2}{$3$}}
\put(0,208){\sx{2.2}{$2$}}
\put(0,108){\sx{2.2}{$1$}}
\put(0,8){\sx{2.2}{$0$}}
\put(10,-4){\sx{2.2}{$0$}}
\put(110,-4){\sx{2.2}{$1$}}
\put(151,-4){\sx{2.1}{$\pi/2$}}
\put(210,-4){\sx{2.2}{$2$}}
\put(320,-3){\sx{2.2}{$x$}}
%\put(140,166){\sx{2.8}{$y\!=\! \sqrt{3/x}$}}
%\put(135,56){\sx{2.8}{$y\!=\!\mathrm{SuSin}(x)$}}
\end{picture}
\end{document}
File history
Click on a date/time to view the file as it appeared at that time.
| Date/Time | Thumbnail | Dimensions | User | Comment | |
|---|---|---|---|---|---|
| current | 06:10, 1 December 2018 | | 689 × 904 (61 KB) | Maintenance script (talk | contribs) | Importing image file |
- You cannot overwrite this file.
File usage
The following page links to this file: