File:Expe1eplotT.jpg
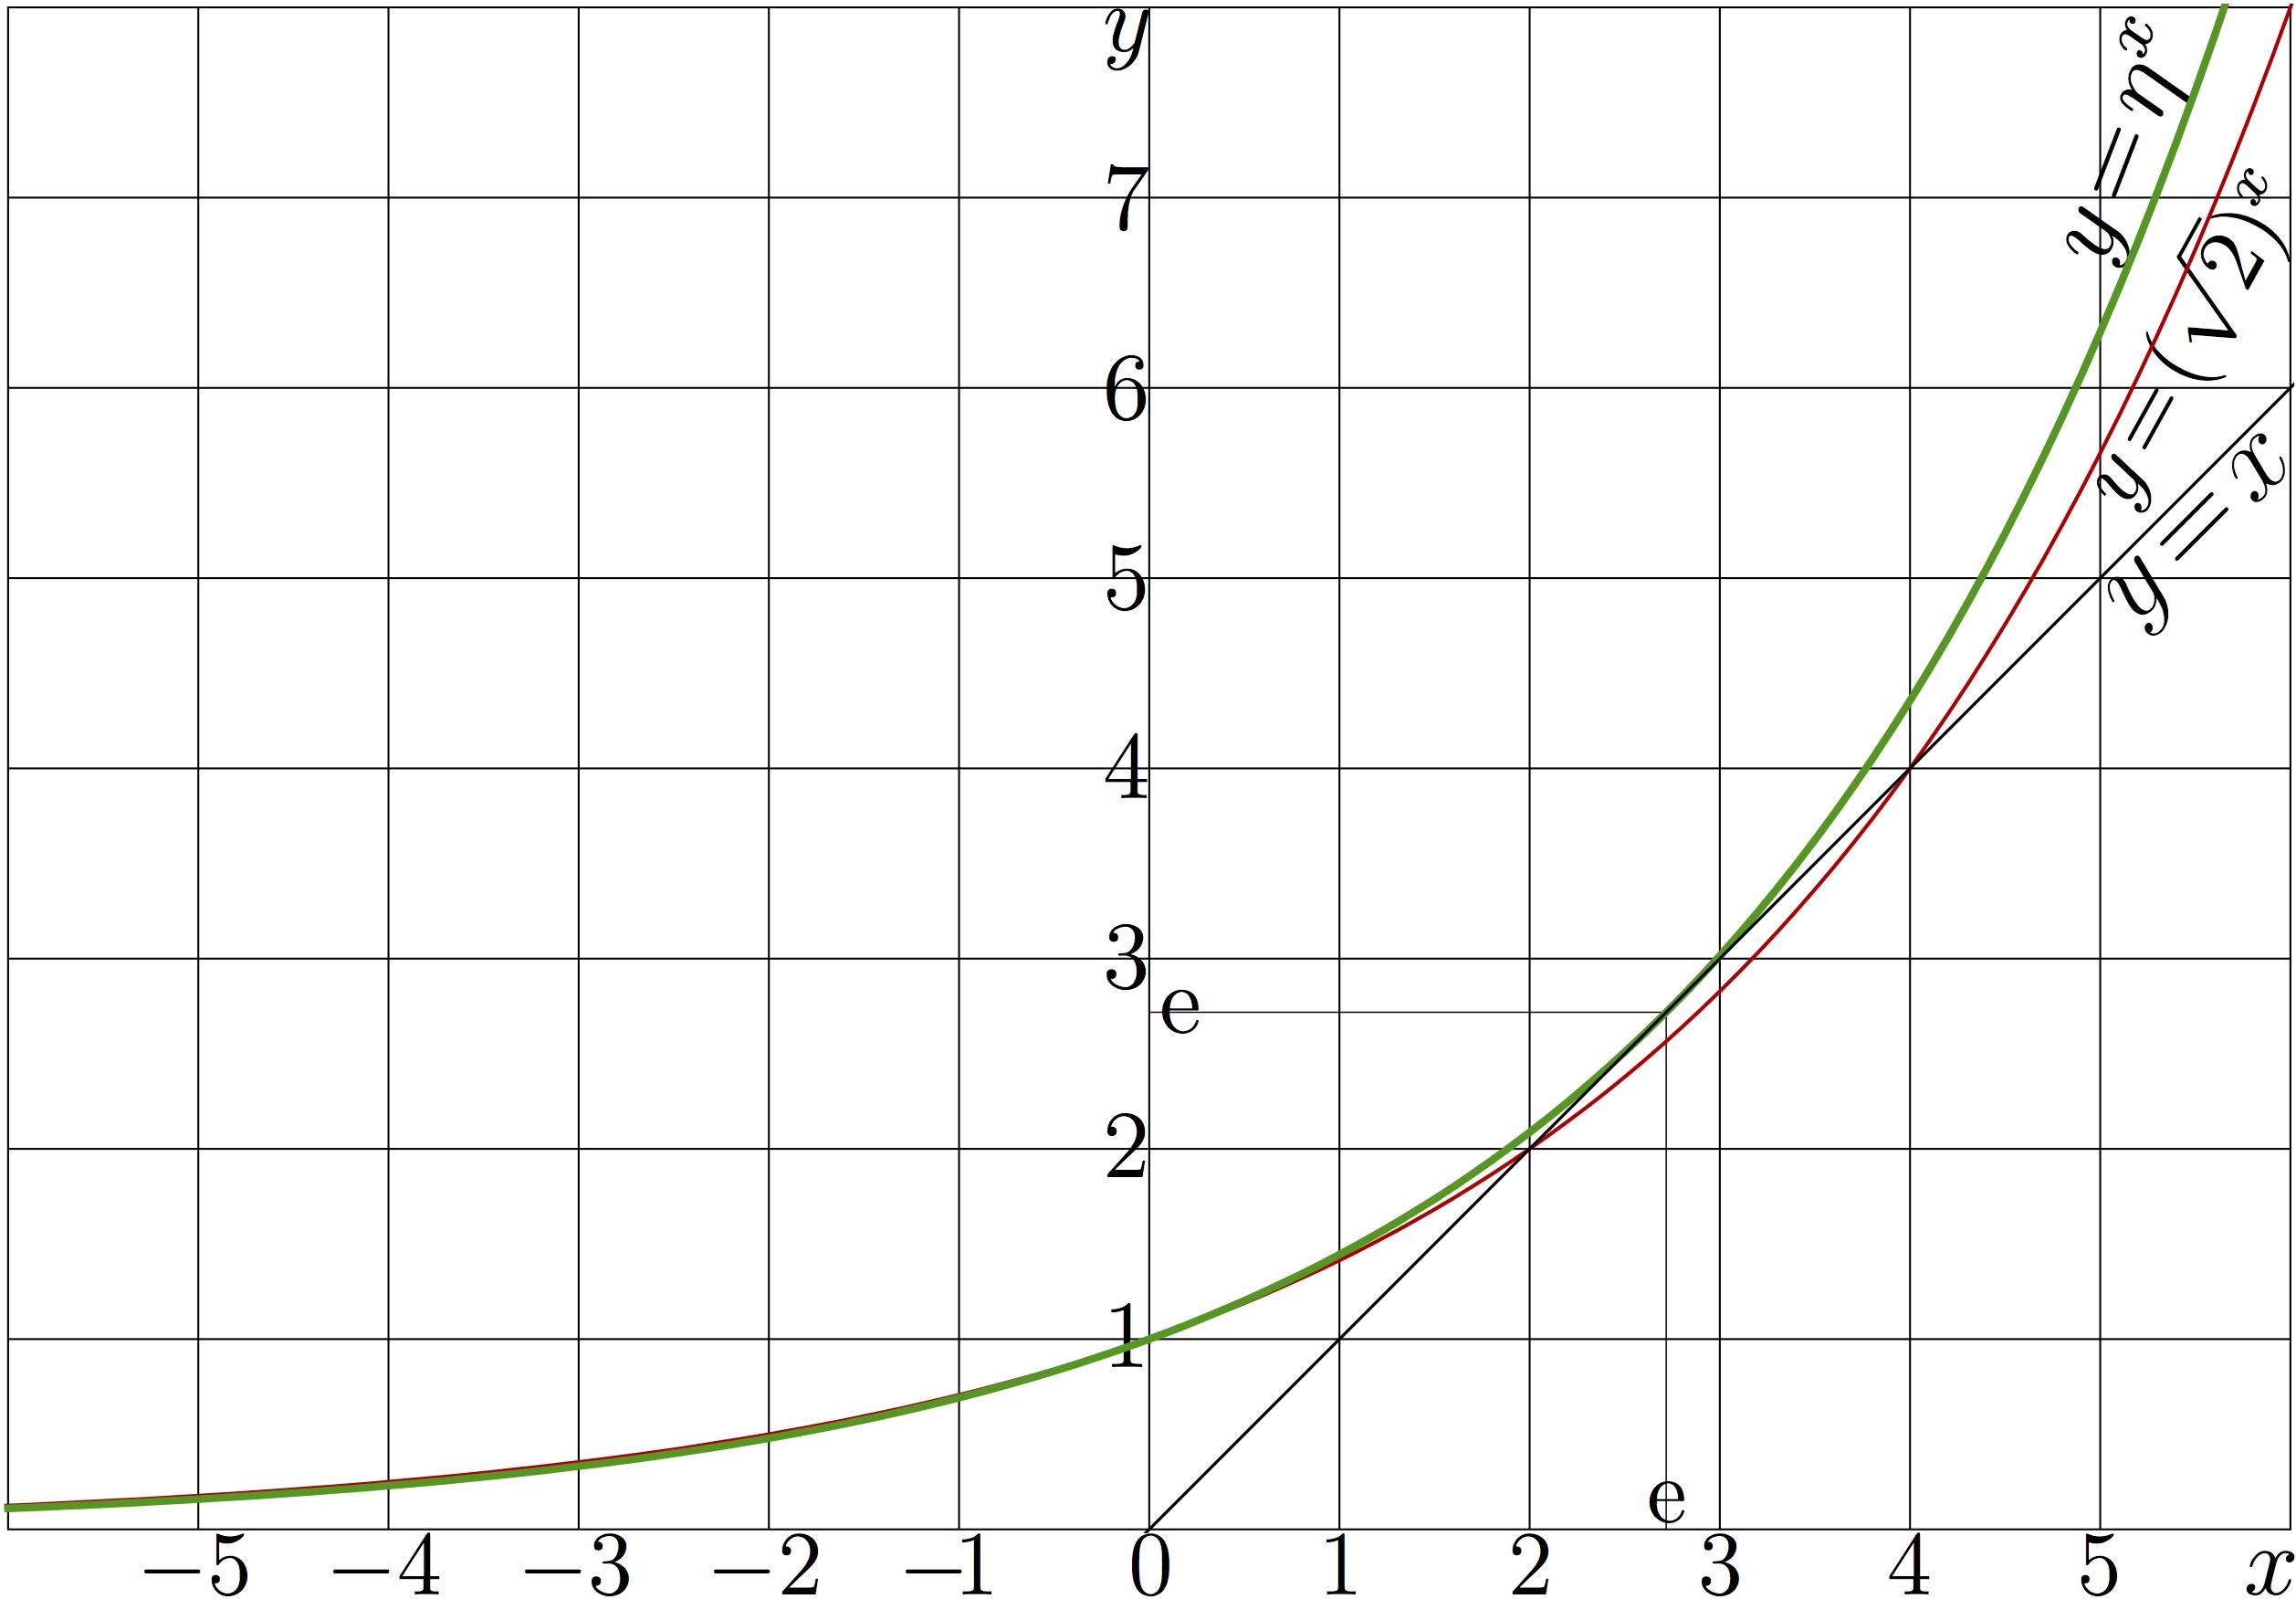
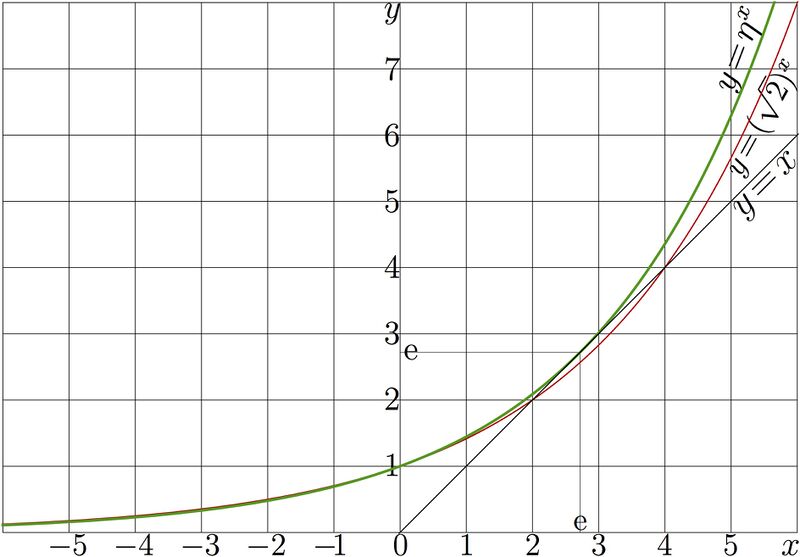
Explicit plot of exponential to base e1e (thick green curve) and that of the exponential to base sqrt2 (thin red curve)
Here, $\eta\!=\!\exp(1\mathrm e)\!\approx1.44466786$\! is the Henryk base. At this base the exponential has only one real fixed point, id est, equation $\exp_\eta(L)\!=\!L$ has only one real solution $L\!=\!\mathrm e\!\approx\! 2.71~$.
The thick green curve is $!y\!=\!\eta^x$.
In order to show the fixed point, the thin line $y\!=\!x$ is drawn.
For comparison, the exponential to base $b\!=\! \sqrt{2}$ is plotted, that has two fixed points, $L\!=\!2$ and $L\!=\!4$.
C++ generator of curves
//
#include<math.h>
#include<stdio.h>
#include<stdlib.h>
#define DB double
#define DO(x,y) for(x=0;x<y;x++)
#include "ado.cin"
DB B=sqrt(2.);
int main(){ int m,n; double x,y; FILE *o;
o=fopen("expe1eplot.eps","w"); ado(o,1204,804);
fprintf(o,"602 2 translate 100 100 scale\n");
#define M(x,y) fprintf(o,"%6.3f %6.3f M\n",0.+x,0.+y);
#define L(x,y) fprintf(o,"%6.3f %6.3f L\n",0.+x,0.+y);
for(m=-6;m<7;m++) {M(m,0)L(m,8)}
for(m=0;m<9;m++) {M(-6,m)L(6,m)}
fprintf(o,"2 setlinecap .01 W S\n 1 setlinejoin \n");
M(M_E,0)L(M_E,M_E)L(0,M_E) fprintf(o,".007 W S\n");
for(m=0;m<123;m++){x=-6.1+.1*m; y=exp(log(B)*x); if(m==0)M(x,y) else L(x,y);} fprintf(o,".02 W .8 0 0 RGB S\n");
for(m=0;m<123;m++){x=-6.1+.1*m; y=exp(x/M_E); if(m==0)M(x,y) else L(x,y);} fprintf(o,".04 W 0 .6 0 RGB S\n");
M(-.1,-.1)L(6.1,6.1) fprintf(o,".016 W 0 0 0 RGB S\n\n");
fprintf(o,"showpage\n%c%cTrailer",'%','%'); fclose(o);
system("epstopdf expe1eplot.eps");
system( "open expe1eplot.pdf");
getchar(); system("killall Preview");//for mac
}
//
Latex generator of labels
%
\documentclass[12pt]{article}
\usepackage{geometry}
\usepackage{graphicx}
\usepackage{rotating}
\paperwidth 1212pt
\paperheight 844pt
\topmargin -92pt
\oddsidemargin -80pt
\textwidth 1604pt
\textheight 1604pt
\pagestyle {empty}
\newcommand \sx {\scalebox}
\newcommand \rot {\begin{rotate}}
\newcommand \ero {\end{rotate}}
\newcommand \ing {\includegraphics}
\parindent 0pt
\pagestyle{empty}
\begin{document}
{\begin{picture}(1202,802)
\put(590,792){\sx{4.2}{$y$}}
\put(590,698){\sx{4.2}{$7$}}
\put(590,598){\sx{4.2}{$6$}}
\put(590,498){\sx{4.2}{$5$}}
\put(590,398){\sx{4.2}{$4$}}
\put(590,298){\sx{4.2}{$3$}}
\put(620,274){\sx{4.2}{$\mathrm e$}}
\put(590,198){\sx{4.2}{$2$}}
\put(590,098){\sx{4.2}{$1$}}
\put(080,-22){\sx{4}{$-5$}}
\put(180,-22){\sx{4}{$-4$}}
\put(281,-22){\sx{4}{$-3$}}
\put(381,-22){\sx{4}{$-2$}}
\put(482,-22){\sx{4}{$-\!1$}}
\put(603.6,-22){\sx{4}{$0$}}
\put(703.7,-22){\sx{4}{$1$}}
\put(803.8,-22){\sx{4}{$2$}}
\put(877.,16){\sx{4}{$\mathrm e$}}
\put(903.9,-22){\sx{4}{$3$}}
\put(1004.0,-22){\sx{4}{$4$}}
\put(1104.1,-22){\sx{4}{$5$}}
\put(1192.2,-22){\sx{4.3}{$x$}}
%\put(0815,520){\sx{5.6}{\rot{78}$y\!=\!\exp(x)$\ero}}
\put(1118,678){\sx{4.5}{\rot{69}$y\!=\!\eta^x$\ero}}
%\put(1076,606){\sx{4.1}{\rot{67}$y\!=\!\exp_{\eta}(x)$\ero}}
%\put(1100,520){\sx{4}{\rot{62}$y\!=\!\exp_{_{\!\!\sqrt{2}}}(x)$\ero}}
\put(1130,550){\sx{4}{\rot{61}$y\!=\!(\sqrt{2})^x$\ero}}
\put(1134,488){\sx{5}{\rot{45.1}$y\!=\!x$\ero}}
\put(10,10){\ing{expe1eplot}}
\end{picture}}
\end{document}
File history
Click on a date/time to view the file as it appeared at that time.
| Date/Time | Thumbnail | Dimensions | User | Comment | |
|---|---|---|---|---|---|
| current | 06:12, 1 December 2018 | | 2,515 × 1,751 (350 KB) | Maintenance script (talk | contribs) | Importing image file |
- You cannot overwrite this file.
File usage
The following page links to this file: