Approximations of ruble
Approximations of ruble refers to approximation of the price of rouble, expressed in yen, USA cents and Euro cents, with holomorphic functions of time.
The project begun 2014.10.27, and this date is chosen as zero at the time scale. Here, time \(t\) since that date is measured in days.
The data used to construct the approximations (and to plot figures) are loaded from
https://www.mataf.net/en/currency/converter-JPY-RUB
https://www.mataf.net/en/currency/converter-USD-RUB
https://www.mataf.net/en/currency/converter-EUR-RUB
The data show the strong inflation of rouble, that can be attributed to the professional inconsistency as well as to bad will, corruption of the administration of the Russian National bank.
Contents
Linear approximation for dollars
First, the data for dollars sere loaded, see Fig.1; then, the data for Euro and then for Yen, see Fig.2. and Fig.3.
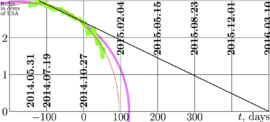
The first approximation of the price of rouble, expressed in the USA penny (0.01 of the USA dollar), had been suggested with linear function, it is shown in figure 1.
That approximation had been elaborated at \(t=0\), id est, 2014.10.27.
Later, the new experimental dots are added to the same graphic (and stored in the same file).
After a month since the beginning of the project, the experimental dots happened to be below the straight black line, and the approximation with circle is added in the same figure.
Then, approximately 2014.12.14 –2014.12.16, the circle had been also appeared to be above the new experimental dots. The circle is just visual feeling of the shape of the trend of the data; there are no other reasons to establish equivalence of the price of rouble in the USA cents and the time, measured in days. This indicated the next approximation, with ellipse, shown with thin red line. The small axis of this ellipse is placed to the abscissa axis.
In such a way, Fig 1 compares the linear approximation (straight black line) to the experimental data and two other approximations of the same data.
Elliptic approximation
The linear approximation has 2 parameters. In order to improve the approximation, at least one additional parameter is necessary. Various approximations with elementary functions with 3 parameters had been considered. Approximation with ellipses happened to be significantly better, than others. The fitting functions have the following form:
\(\mathrm{fit}(t)=c \sqrt{(t+a)(b-t)}\)
For example, one of the best fits for the rouble, measured in the USA cents (intermediate thin curve in figure 3) corresponds to the following values of parameters:
\(a=313\), \(b=84\), \(c=0.0146\)
For these values, the mean square deviation \(Q\) and the mean deviation \(D\) of the fit are estimated:
\(\displaystyle Q=\sqrt{\frac{1}{N}\sum_{n=0}^{N-1} \Big( \mathrm{fit}(t_n) - g_n\Big)^2} \approx 0.06\)
\(\displaystyle D= \frac{1}{N}\sum_{n=0}^{N-1} \Big| \mathrm{fit}(t_n) - g_n\Big| \approx 0.05\)
where \(N=203\) is number of experimental data \(g_n\), that correspond to time \(t_n\) for \(0\le n <N\). This \(N\) corresponds to date 2014.12.19.
Similar (a little bit larger) deviations correspond to the fittings of data for yen and Euro cents.
In such a way, the elliptic approximations has the relative error of order of few percent, fitting the experimental data with two significant figures
This should be considered as a good fit, while variation of the fitted quantity (price of rouble) is of order of this quantity. During the observed interval of time, the price of rouble varies from 3 penny to 1.5 penny.
The most important parameter is \(b\). This parameter indicates, how many days the approximation may hold since the beginning of the project.
Addition of data for Euro and for Yen
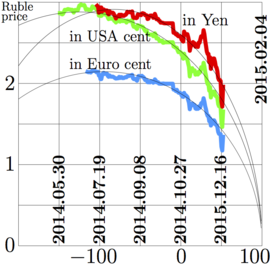
The prices in euro and in yen had been added with blue and red lines. The precision approximation of the brach point does not allow to determine it with relative error less than 10%, so, the coordinate in the approximations is rounded to 100. The result is shown in the Fig.2. The inflation happens to be fast compared to the scale, determined by the liar approximation in Fig. 1, so, the range of values of time \(t\), covered with the figure, is reduced. The additional grid line are added in order to simplify the comparison of data by https://www.mataf.net/en/currency/converter-USD-RUB to the data by other publications and speculations.
2015.12.14, the curves happened to be significantly below the ellipses, and the storm alert had been issued. Indeed, In next two days, the hard drop of price of ruble had been observed.
In the first version of the figure, the experimental data had been marked with small circles. Then, 2015.12.16. the drop of the rouble happened to be strong, and the experimental dots for different cases (yen, USA cents and Euro cents) in the new data set overlapped. In order not to confuse them, these marks are replaced to the continuous curves; but the approximations with ellipses are kept the same.
Pessimistic estimate and extrapolation
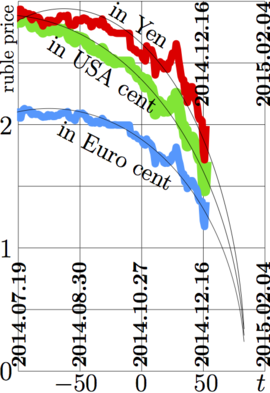
Initially, the ellipses in the first two figures were exected to provide some "pessimistic", lower estimate for the extrapolation. As the experimental curces hapen to be even lower, the three more elliptic approximations are suggested in the third figure. The data are the same, the onlu field of the figure is shortened and the ellipses are a little bit sharpened.
Up to my knowledge, at least before 2014.12.18, no other approximations of price or rouble with holomorphic functions had been reported.
The approximations in Fig. 2 predict the collapse of the Russian rouble in the beginning of February of 2014.
The approximations in Fig. 3 predict the collapse of the Russian rouble in the beginning of January of 2014.
Up to 2014.12.18, the exerimental data do not allow to say, which of approximations are better: those in Fig. 2 or those in Fig 3.
Speculations and interpretation
The fast decrease of price of rouble should be attributed to the uncontrolled, irresponsible emission of the Russian currency by the Russian Central Bank.
This emission could be caused by the non–documented expenses for Russian invasion into Ukraine, preparation of the Putin world war (that cause additional expenses) and the sanctions, both from side of the foreign countries and from the Russian government, that reduce the reduce the tax flow and enhance the price of goods imported into Russia.
The short tie platoes (during 10 or 20 days) can be attributed to attempts of the Central Bank of Russia to keep the national valute, spending the reserve funds for the money exchange, using the politically-motivated course.
The drop of price 2014.12.16 can be interpreted as the result of the big emission of rubles in a single trance, lending of this trance to credit the "Rosneft", that converted it to dollars in order to use some part of these dollars in future to pay the debt with demominated rubles.
The irresponsible behaviour of the Russian Central Bank may be related with misinformative publications in the official Russian mass-media, that often declare the drop of prise of the USA dollar measured in Russian rouble, and avoid discussions of the progressive inflation of the Russian rouble.
Exprapolation of the linear approximation in Fig.1. can be interpreted as indication on the crash of the financial system of Russia within years 2015-2016. During 50 days since its suggestion, this approximation remains the upper bound of price of rouble in american cents.
Extrapolations of the approximations shown in figures 2 and 3 may indicate the collapse of the Russian finance system at the beginning of year 2015.
It will be interesting to see, how far the elliptic fit of the price or rouble will hold in the future.
P.S.: Other approximations showed the similar pessimism; but soon after publication [1], the ruble a little bit stabilized, and its value fluctuates between one and two American cents.
Conclusion

The experimental data presented in figures 1,2,3 show the strong inflation of rouble.
The linear approximation (Fig.1) can be interpreted as prediction of collapse of the Russian financial system in 2015–2016. During 50 days since the elaboration, this approximation remains the upper bound of the rouble measured in the US cents.
The elliptic approximations suggest the collapse of the Russian financial system at the beginning of year 2015, for January (Fig.3) or for February (Fig.2). Up to my knowledge, yet, no other approximations of price of rouble with holomorphic functions have been suggested for the last 200 days of year 2014. In this sense, the figures 1,2 and 3 should be considered as scientific predictions.
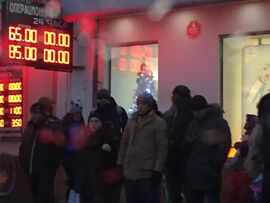
This inflation can be attributed to the professional inconsistency as well as to bad will, corruption of the administration of the Russian National bank. The last interpretation agrees with the general concept of the total corruption (Fig. 4) of the Russian administration at the beginning of century 21 [3][4].
The fitting with ellipse above happened to be very good in comparison to other three-parametric fittings with holomorphic functions. This may give hint to construction of a mathematical model that corresponds to the most efficient way of the money laundering in the amount comparable to the total value of all the goods in a country. Building of such a model may be continuation of this research.
References
- ↑ http://www.m-hikari.com/ams/ams-2015/ams-17-20-2015/kouznetsovAMS17-20-2015.pdf D.Kouznetsov. Currency band and the approximations: Fitting of rouble with 3-parametric functions. Applied Mathematical Sciences, Vol. 9, 2015, no. 17, 831 - 838
- ↑ http://asaratov.livejournal.com/530843.html ..талисман проекта "Сочи - 2014". November 22nd, 2010
- ↑ http://kremlin.ru/transcripts/1566 Д.Медведев. Вступительное слово на заседании Совета по противодействию коррупции. 30 сентября 2008 года, 16:25 Москва, Кремль. Д.Медведев: Коррупция в нашей стране приобрела не просто масштабный характер, она стала привычным, обыденным явлением, которое характеризует саму жизнь в нашем обществе...
- ↑ http://en.rian.ru/russia/20120426/173064569.html Marc Bennetts. Medvedev Admits Failure in Fight against Corruption. 13:24. 26/04/2012
https://www.mataf.net/en/currency/converter-JPY-RUB
https://www.mataf.net/en/currency/converter-USD-RUB
https://www.mataf.net/en/currency/converter-EUR-RUB
2014.12.16. http://www.m24.ru/articles/62461 Падение отечественной валюты на бирже в большой степени объясняется эмоциями и спекулятивными факторами, заявил пресс-секретарь президента Дмитрий Песков. 16.12.2014 19:44.
2014.12.17. http://www.echo.msk.ru/blog/ztr/1457484-echo/ Cергей Запорожский. Крым. Зона не отдыха и не бизнеса. 19:47 , 17 декабря 2014. .. Уже нынешний курс рубля к доллару говорит о том, что Крым вернется домой гораздо раньше, чем предрекали самые большие оптимисты. ..
2014.12.18. http://www.rosbalt.ru/piter/2014/12/18/1350215.html САНКТ-ПЕТЕРБУРГ, 18 декабря. До Нового года курс рубля будет стабилизироваться, поскольку после 20 декабря начнется период налоговой отчетности, что усилит спрос на рубли. Таким мнением с корреспондентом "Росбалта" поделилась доктор экономических наук Ирина Лукашевич. Росбалт, 18/12/2014 20:07
2014.12.18. http://gorod55.ru/news/article/b90ceb90-553f-420b-b5a7-31dff737bc7e Доллар и евро стремительно падают – ниже 57 и 71 рублей соответственно. Бизнес 18.12.2014 14:05.
Keywords
Corruption, Inflation, Putin world war, Roube, Ruble, Russia, Russian invasion into Ukraine, Stop Putin


