File:2020continuousUSaverageTemperatur.png
Size of this preview: 800 × 441 pixels. Other resolutions: 320 × 176 pixels | 859 × 473 pixels.
Original file (859 × 473 pixels, file size: 110 KB, MIME type: image/png)
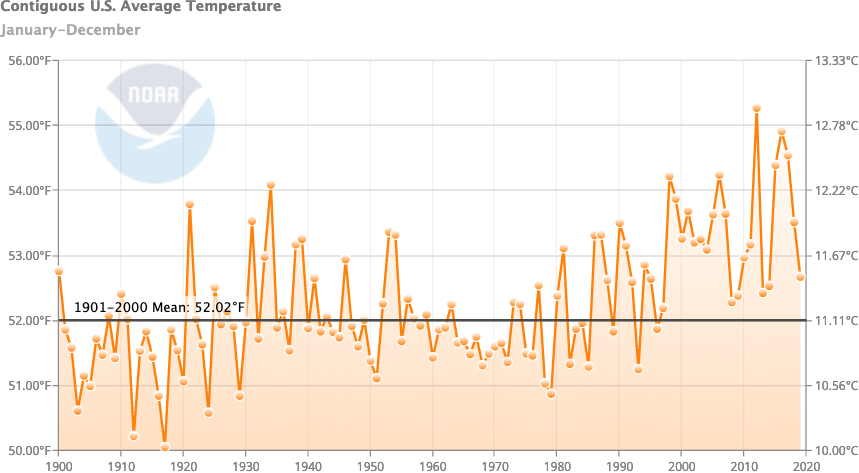
Rise of mean temperatude at the USA since year 1900 by ncdc.noaa.gov [1]
References
- ↑ https://www.ncdc.noaa.gov/cag/national/time-series/110/tavg/12/12/1900-2020?base_prd=true&begbaseyear=1901&endbaseyear=2000 Climate at a Glance (2020) National Time Series Choose from the options below and click "Plot" to create a time series graph. Palmer Drought Severity Index (PDSI), Palmer Hydrological Drought Index (PHDI), and Palmer Modified Drought Index (PMDI) are not offered for multiple-month time scales. Display Base Period Start: End: Display Trend per Decade per Century Start: End: Smoothed Time Series Binomial Filter LOESS Filter Parameter: Time Scale: Month: Start Year: End Year:
File history
Click on a date/time to view the file as it appeared at that time.
| Date/Time | Thumbnail | Dimensions | User | Comment | |
|---|---|---|---|---|---|
| current | 23:21, 23 September 2020 | | 859 × 473 (110 KB) | T (talk | contribs) |
- You cannot overwrite this file.
File usage
The following page links to this file: