File:4t1.jpg

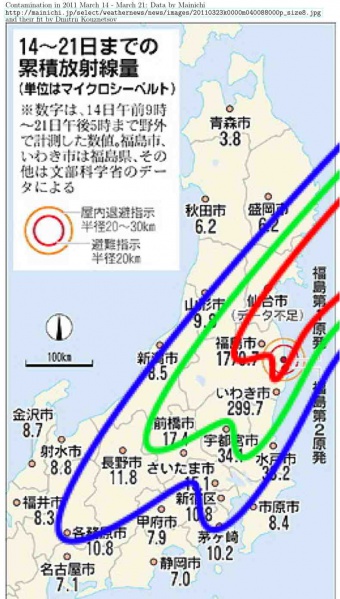
Map of contamination that is usually attributed to the Fukushima disaster, average for 2011 March 14-21.
Contour of land/sea/cities and the primary data are by Devchonka from http://mainichi.jp/select/weathernews/news/images/20110323k0000m040088000p_size8.jpg
Contours of contamination are by Dmitrii Kouznetsov by the data mentioned above; this is primitive preliminary model. I load this contours in order to show the specialists, what do I call "map of contamination", in order to explain, what kind of graphical information do I expect from the colleagues who work in monitoring of the contamination. I hope they can do it much better than I did. The detailed professional map is necessary to make the adequate decision: who should flee and which place is suitable for the evacuation.
In particular, according to the fit suggested, Sendai (look for canji 仙台市 at the map) is not a good place for the hosting of the refugees: although it is 60km away from Fukushima, it is at the edge of the most contaminated area.
The Japanese-speaking colleagues confirm, that the creator(s) of the original picture did not specify well the units of measurement. The comparison with tables http://www.mext.go.jp/component/a_menu/other/detail/__icsFiles/afieldfile/2011/03/17/1303724_6_3.pdf suggests that the number are estimates of amount of radiation measured in mSv/year.
In this case, the values should be divided by $24\cdot365.25\approx 8766$ in order to get the estimate in mSv/hour. Roughly, divide by 9, and the result will be in $\mu \rm Sv/h$.
For comparison: http://web.princeton.edu/sites/ehs/osradtraining/backgroundradiation/background.htm suggests the estimate for the mean annual dose for the USA population, 620 millirem/year. Assuming that one rem=10mSv, this corresponds to 6.2 mSv/year, slightly more than the value indicated for the North of Japan. In such a way, the guess about units of measurement shows qualitative agreement with other data.
By the way, why there are so few data available? Either in the whole Japan, there are only few tens of cities with stations of monitoring? I think the colleagues who work in this area could make much more detailed map.
P.S.Anyway, I am glad that at least these data are released.
P.P.S. See also http://gebweb.net/japan-radiation-map/
P.P.P.S. According to http://www.lavoad.org/images/Yale-Tulane_ESF-8_MOC_Brief_Secial_Report_-_15_MAR_2011.pdf and http://www.webcitation.org/mainframe.php
, the epicenter of the Earthquake (38.322°N, 142.369°E) is within the main trace of the contamination of the fit extended to the Sea. Is it just an occasion, a coincidence?
Questions
I do not understand..
March 2011, I have posted the fit, that indicates, that, at least in the inner loop, the people should take their children and drive away. First drive away, then to discuss this in the court. Then the discussion would be only about the money, not about the health...
In particular, this applies to Koriyama, it is the left–down tip of the main loop. But the movie [1] indicates that at least for 2012 April, id est, a year later, the people still discuss, wether to evacuate children or not..
Perhaps it is my fault, I still could not describe my results in Japanese.. Kouznetsov 04:40, 4 February 2013 (JST)
P.S. My area is quantum mechanics and Laser science! Why did I have to do that a dirty work? Why the professional dosimetrists and radiologists did not do their job? They could make such a map and such a fit better than I did, earlier than I did, and they could present their results in Japanese, and save thousands children from the problems with their thyroids.. And even if they are so lazy, they could pick up my map, I had sent the link to various administrations. They could alert the peolpe..だからも!
P.P.S. The updating map is available at http://jciv.iidj.net/map/ for example,
For 2013.02.08.16:00, for Koriyama, it suggests 500nSv/h
For 2013.02.09.11:00, for Koriyama, it suggests 510nSv/h;
see also http://radioactivity.mext.go.jp/map/ja/graph.html
and http://radioactivity.mext.go.jp/map/ja/area2.html?getgeo
References
- ↑ http://www.youtube.com/watch?v=6bRcT8aNvlQ Court about children at Koriyama, the lower–left tip of the main lobe at main trail, inner lobe. Fukushima Class Action for Collective Evacuation----World Citizens' Tribunal (17 March 2012 Koriyama. UEKI HIROSHI·94 videos. This conference held in Koriyama City 60 kilometers from the Fukushima Daiichi nuclear power plant, traces the court proceedings of a class action lawsuit brought forward by 14 children living in Koriyama. The children are seeking evacuation rights from Koriyama City. The district court of Koiyama ruled against the plaintiffs on 26 December 2011. The case is now in Sendai Appellate Court.
http://www.panorientnews.com/en/news.php?k=891 Monday March 28, 2011. Greenpeace Team Finds Higher Range of Radiation Level in Iitate.. the high radiation is reported at the North-West from Fukushima, and 20lm beyond the official evacuation zone
http://www.panorientnews.com/en/news.php?k=900 Japanese Government Asked for Action on Fukushima Nuclear Disaster. Monday, April 4, 2011. .. 3. To increase the number of radiation monitoring locations,..
http://www.nnistar.com/gmap/fukushima.html Map of contaminaiton for June, 2011
Similar maps


More recent and more detailed maps above are available. The comparison shows, that the trace from Notrh-East to the South-West is caught by the early fit of the sparse Mainichi data, the pic of the fit is repeated at right.
File history
Click on a date/time to view the file as it appeared at that time.
| Date/Time | Thumbnail | Dimensions | User | Comment | |
|---|---|---|---|---|---|
| current | 17:49, 20 June 2013 | | 789 × 1,391 (86 KB) | Maintenance script (talk | contribs) | Importing image file |
- You cannot overwrite this file.
File usage
The following 12 pages link to this file: