File:SuTraPlo3T.jpg
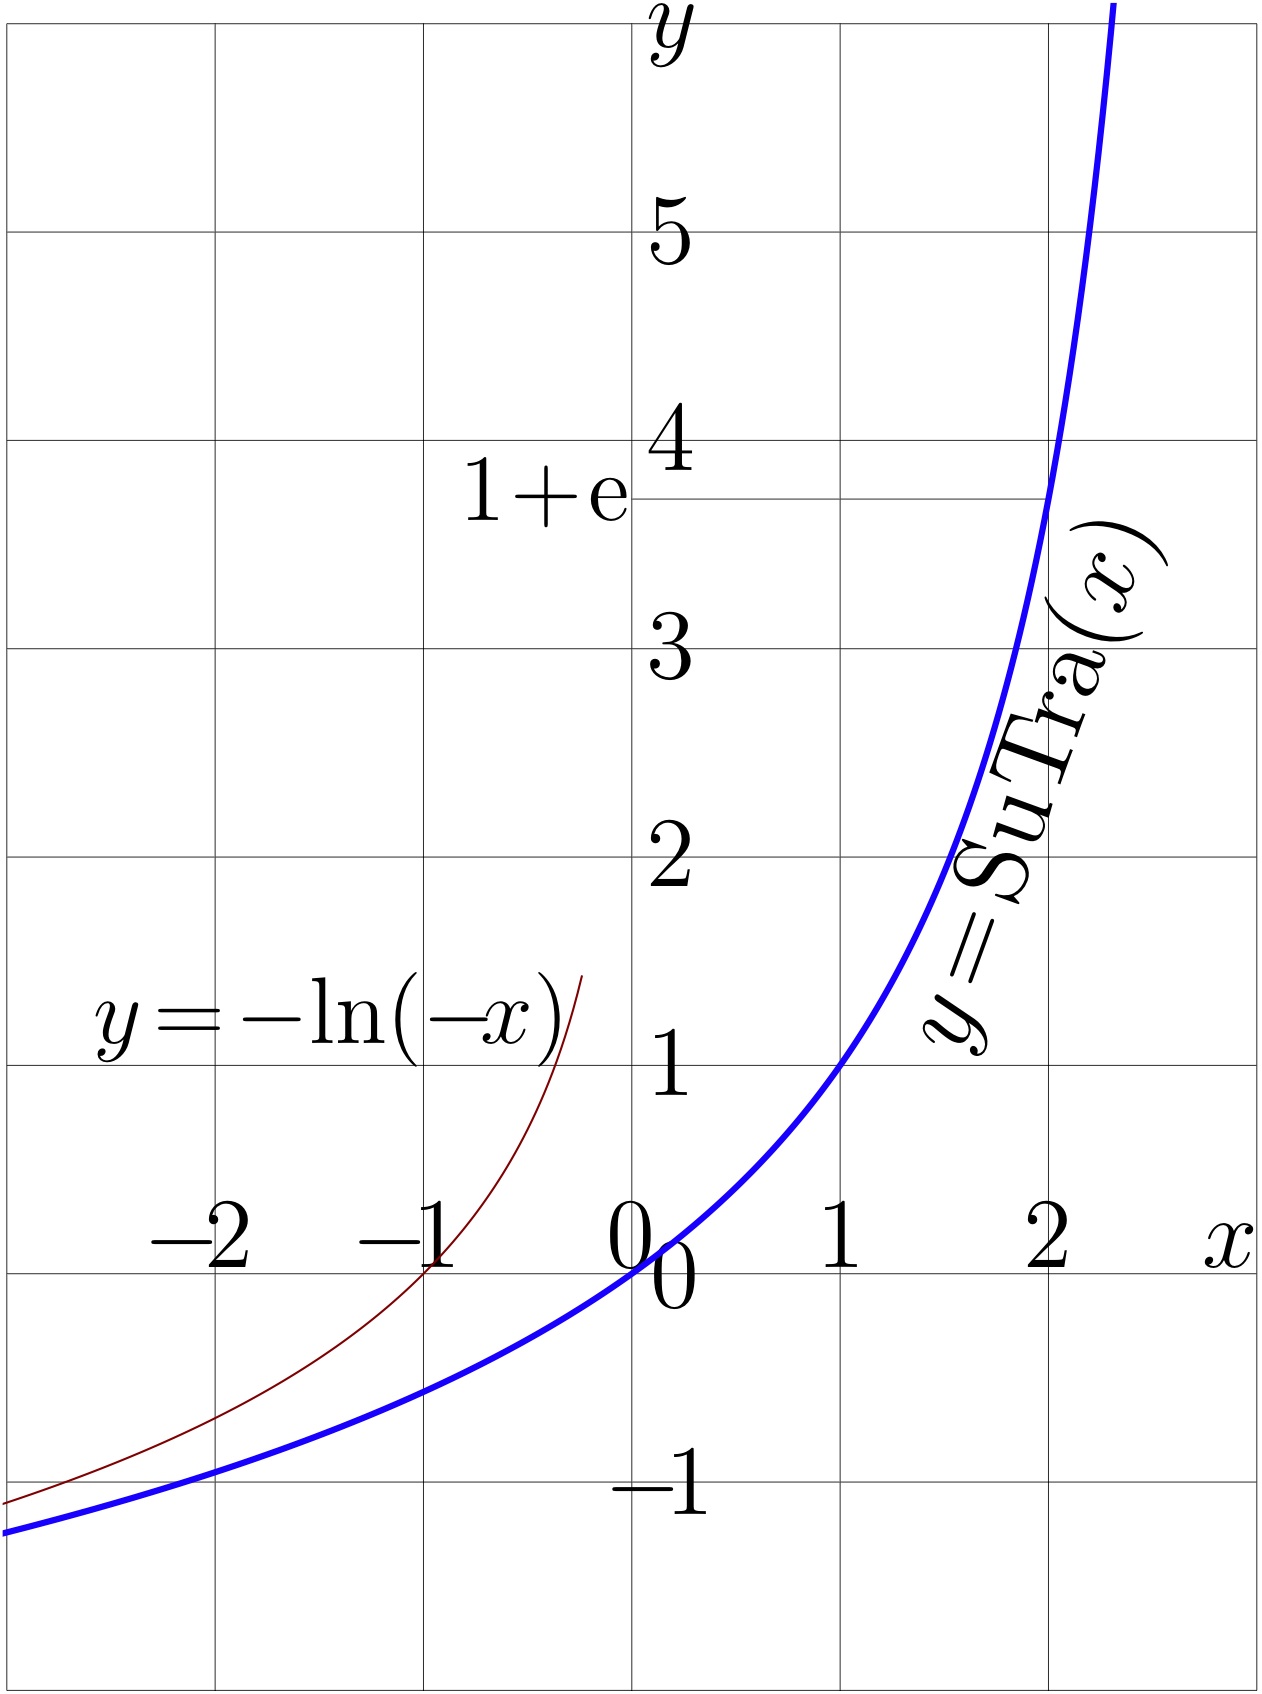
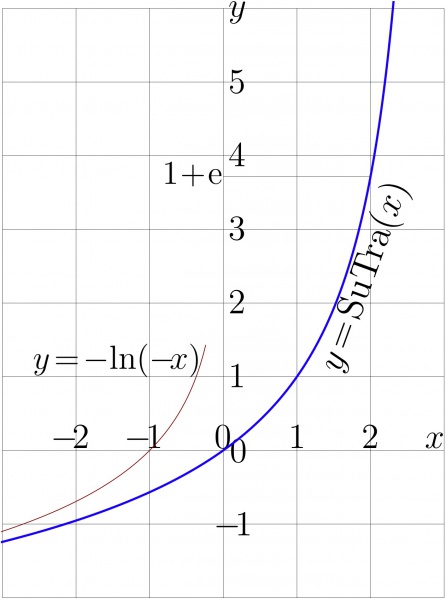
Plot of funciton SuTra, id est, Superfunction of the Trappmann function $\mathrm{Tra}(z)\!=z\!+\!\exp(z)$.
The thick blue curve shows $y\!=\!\mathrm{SuTra}(x)$
The thin dark brown curve shows the asymptotics, $y\!=\! - \ln(-x)$
The additional horizontal gridline shows $1\!+\!\mathrm e=\mathrm{SuTra}(2)$
C++ generator of curves
// Files ado.cin, SuZex.cin, LambertW.cin and Tania.cin sould be loaded to the working directory in order to compile the C++ code below.
#include <math.h>
#include <stdio.h>
#include <stdlib.h>
#define DB double
#define DO(x,y) for(x=0;x<y;x++)
using namespace std;
#include<complex>
typedef complex<double> z_type;
#define Re(x) x.real()
#define Im(x) x.imag()
#define I z_type(0.,1.)
#include "Tania.cin" // need for LambertW
#include "LambertW.cin" // need for AuZex
#include "SuZex.cin"
//#include "AuZex.cin"
z_type tra(z_type z){ return exp(z)+z;}
//z_type F(z_type z){ return log(suzex(z));}
//z_type G(z_type z){ return auzex(exp(z));}
z_type sutra(z_type z){ if( Re(z)<2. || fabs(Im(z))>2. ) return log(suzex(z));
                                                         return tra(sutra(z-1.));}
#include "ado.cin"
#define M(x,y) fprintf(o,"%6.4f %6.4f M\n",0.+x,0.+y);
#define L(x,y) fprintf(o,"%6.4f %6.4f L\n",0.+x,0.+y);
main(){ int j,k,m,n; DB x,y, p,q, t; z_type z,c,d;  FILE *o;o=fopen("SuTraPlo3.eps","w");  ado(o,604,812);
fprintf(o,"302 202 translate\n 100 100 scale\n");
fprintf(o,"1 setlinejoin 2 setlinecap\n");
for(n=-2;n<7;n++) {M(-3,n)L(3,n)}
for(m=-3;m<4;m++) {M(m,-2)L(m,6)}
// M(M_E,0)L(M_E,1) M(0,M_E)L(1,M_E)
M(0,1.+M_E) L(2,1.+M_E)
fprintf(o,".004 W S\n");
// DO(m,700){x=.01 +.02*m; y=Re(LambertW(LambertW(x)));if(m==0) M(x,y) else L(x,y) if(x>12.03||y>12.03) break;} fprintf(o,".033 W 1 0 0 RGB S\n");
// DO(m,700){x=.01 +.02*m; y=Re(LambertW(x));if(m==0) M(x,y) else L(x,y) if(x>12.03||y>12.03) break;} fprintf(o,".04 W 1 .5 0 RGB S\n");
// M(0,0) L(12.03,12.03) fprintf(o,".04 W 0 1 0 RGB S\n");
DO(m,700){x=-5.02 +.02*m; y=Re(sutra(x));  if(m==0) M(x,y) else L(x,y) if(x>3.03||y>6.1) break;} fprintf(o,".03 W 0 0 1 RGB S\n");
DO(m,240){x=-5.02 +.02*m; y=-log(-x);      if(m==0) M(x,y) else L(x,y) if(x>3.03||y>6.03) break;} fprintf(o,".01 W .5 0 0 RGB S\n");
fprintf(o,"showpage\n"); fprintf(o,"%c%cTrailer\n",'%','%');  fclose(o);
     system("epstopdf SuTraPlo3.eps");
     system(    "open SuTraPlo3.pdf"); //for macintosh
     getchar(); system("killall Preview"); // For macintosh
}
Latex generator of labels
% %<br> % file SuTraPlo3.pdf should be generated with the code above in order to compile the Latex document below. %<br> % Copyleft 2012 by Dmitrii Kouznetsov <br> % \documentclass[12pt]{article} % <br> \usepackage{geometry} % <br> \usepackage{graphicx} % <br> \usepackage{rotating} % <br> \paperwidth 608pt % <br> \paperheight 816pt % <br> \topmargin -98pt % <br> \oddsidemargin -71pt % <br> \textwidth 900pt % <br> \textheight 900pt % <br> \pagestyle {empty} % <br> \newcommand \sx {\scalebox} % <br> \newcommand \rot {\begin{rotate}} % <br> \newcommand \ero {\end{rotate}} % <br> \newcommand \ing {\includegraphics} % <br> \parindent 0pt% <br> \pagestyle{empty} % <br> \begin{document} % <br> \begin{picture}(602,805) % <br> \put(310,794){\sx{4}{$y$}} % <br> \put(220,566){\sx{3.8}{$1\!+\!\mathrm e$}} % <br> \put(310,690){\sx{4}{$5$}} % <br> \put(310,590){\sx{4}{$4$}} % <br> \put(310,490){\sx{4}{$3$}} % <br> \put(310,390){\sx{4}{$2$}} % <br> \put(310,289){\sx{4}{$1$}} % <br> \put(312,187){\sx{4}{$0$}} % <br> \put(290, 87){\sx{4}{$-\!1$}} % <br> %\put(325,098){\sx{4}{$0$}} % <br> % <br> \put(068,206){\sx{4}{$-\!2$}} % <br> \put(168,206){\sx{4}{$-\!1$}} % <br> \put(291,206){\sx{4}{$0$}} % <br> \put(392,206){\sx{4}{$1$}} % <br> \put(492,206){\sx{4}{$2$}} % <br> \put(578,206){\sx{4}{$x$}} % <br> % <br> \put(462,308){\sx{4.2}{\rot{70}$y\!=\!\mathrm{SuTra}(x)$\ero}} % <br> \put(44,314){\sx{3.8}{\rot{0}$y\!=\!-\!\ln(-\!x)$\ero}} % <br> %\put(10,10){\ing{ExpQ2plot}} % <br> %\put(10,10){\ing{SuZexPlot511}} % <br> \put(0,0){\ing{SuTraplo3}} % <br> \end{picture} % <br> \end{document} % <br> %
File history
Click on a date/time to view the file as it appeared at that time.
| Date/Time | Thumbnail | Dimensions | User | Comment | |
|---|---|---|---|---|---|
| current | 17:50, 20 June 2013 | | 1,262 × 1,694 (182 KB) | Maintenance script (talk | contribs) | Importing image file |
- You cannot overwrite this file.
File usage
The following page links to this file: