File:Susinploat300.jpg
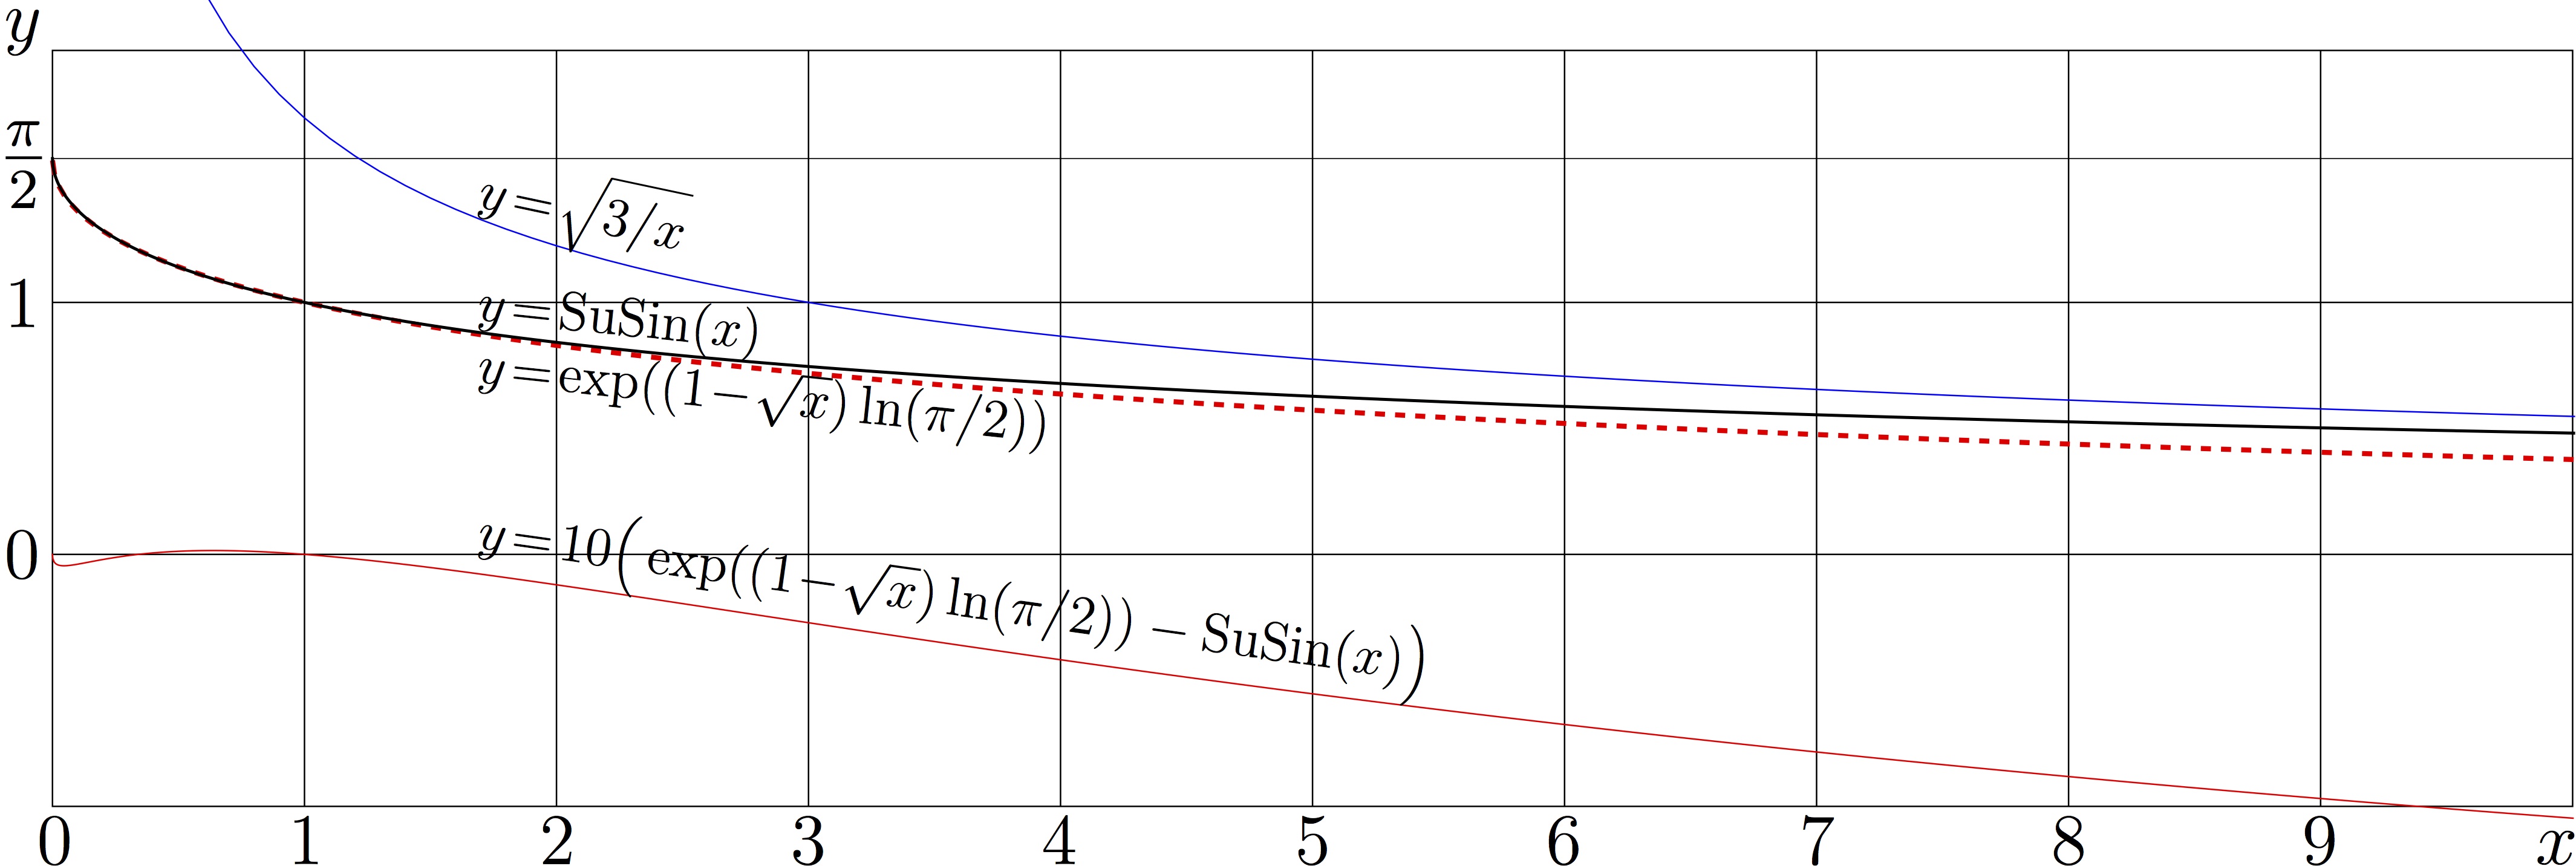
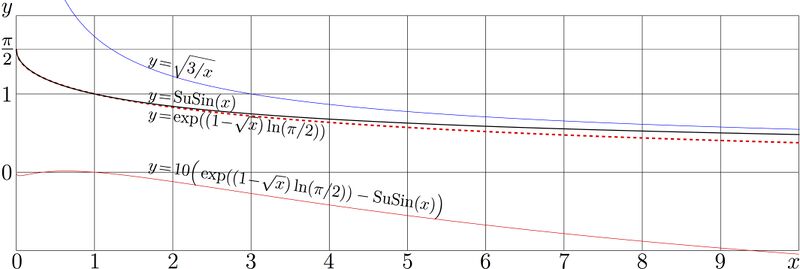
Explicit plot of function SuSin in comparison to its approximations.
Black think solid curve shows $y= \mathrm{SuSin}(x)$, this is superfunction of sin, id est, super sin.
The upper thin blue curves shows the leading term of its asymptotic expansion, $y=\sqrt{3/x}$, suggested in 2012 by Kursernas Hemsidor [1].
The red dashed curve shows the approximation suggested in 2012 by Thomas Curtright [2]
$y=\exp\Big( \big(1\!-\!\sqrt{x}\big)\ln(\pi/2)\Big)$
The lowest red thin curve shows the difference between the $SuSin(x)$ and the approximation by Thomas, scaled with factor 10.
References
- ↑ http://web.abo.fi/fak/mnf/mate/kurser/dynsyst/Iteration%20of%20sin(x).pdf Kursernas Hemsidor. 273027 Introduction to Dynamical Systems 2012. Derivation of Niklas Carlsson;s formula. Cited by the state for December 2013: Let function f(x) be sin(x). We want to evaluate, approximately, the value of the nth iterate of f(x) ... If the formula is correct, it will take 3⋅1010 .. steps to reat 0.00001 from 1. .. $f^n(x)\approx \sqrt{\frac{3}{n}}$, $x\approx 1$, $n$ lage ... How good is this formula? after 60000 iterations of the value 0.0071 and the discrepancy -4.7s-007 ..
- ↑ http://server.physics.miami.edu/~curtright/Schroeder.html Dr. Thomas Curtright. Continuous iterates continue to be interesting, after 150 years of study. (2012) As a first illustration, we display the continuous iterates of the sine function, sin[t](x). Note that the maximum values at x = π/2 are approximately given by exp[(1-√t) ln(π/2)].
C++ generator of curves
//Files ado.cin, arcsin.cin, and susin.cin should be loaded to working directory in order to compile the code below
//
#include <math.h>
#include <stdio.h>
#include <stdlib.h>
#define DB double
#define DO(x,y) for(x=0;x<y;x++)
using namespace std;
#include<complex>
typedef complex<double> z_type;
#define Re(x) x.real()
#define Im(x) x.imag()
#define I z_type(0.,1.)
#include "ado.cin"
#include "arcsin.cin"
#include "susin.cin"
int main(){ int j,k,m,n; DB x,y, p,q, t; z_type z,c,d;
DB x0=0.;
DO(m,14){y=Re(susin(z_type(1.,1.e-9)+x0))-1.;
x0+=4.*y;
printf("%2d %19.16f %19.16f\n",m,x0,y);}
//FILE *o;o=fopen("susinplot1.eps","w"); ado(o,1002,244);
//FILE *o;o=fopen("04.eps","w"); ado(o,1002,348);
FILE *o;o=fopen("susinploa.eps","w"); ado(o,1002,348);
#define M(x,y) {fprintf(o,"%6.4f %6.4f M\n",0.+x,0.+y);}
#define L(x,y) {fprintf(o,"%6.4f %6.4f L\n",0.+x,0.+y);}
fprintf(o,"1 106 translate\n 100 100 scale\n");
fprintf(o,"1 setlinejoin 2 setlinecap\n");
for(m=0;m<11;m++){M(m,-1) L(m,2) }
for(n=-1;n<3;n++){M( 0,n) L(10,n)}
fprintf(o,".006 W 0 0 0 RGB S\n");
M(0,M_PI/2.); L(10,M_PI/2)
fprintf(o,".004 W 0 0 0 RGB S\n");
fprintf(o,"1 setlinejoin 1 setlinecap\n");
DO(m,100){ x=.5+.1*m; y=sqrt(3./x); if(m==0) M(x,y) else L(x,y) ; if ( x>10.) break;}
fprintf(o,".006 W 0 0 1 RGB S\n");
//M(0,M_PI/2.);
fprintf(o,"1 setlinejoin 0 setlinecap\n");
DO(m,300){ x=.0001+.04*m/(1+5./(.3+m)); y=exp((1.-sqrt(x))*log(M_PI/2)); if(m/2*2==m) M(x,y) else L(x,y) ; if ( x>10.) break;}
fprintf(o,".02 W 1 0 0 RGB S\n");
fprintf(o,"1 setlinejoin 2 setlinecap\n");
M(0,M_PI/2.);
DO(m,2002){ x=.005*(m+.3); z=z_type(x,1.e-8); c=susin(z); y=Re(c); L(x,y); printf("%8.5f %8.5f\n",x,y); }
fprintf(o,".012 W 0 0 0 RGB S\n");
M(0,0);
DO(m,20022){ x=.005*(m+.3); z=z_type(x,1.e-8); c=susin(z);
y=exp((1.-sqrt(x))*log(M_PI/2))- Re(c); y*=10; L(x,y); printf("%8.5f %8.5f\n",x,y);
if(x>10) break; }
fprintf(o,".006 W 1 0 0 RGB S\n");
fprintf(o,"showpage\n");
fprintf(o,"%c%cTrailer\n",'%','%');
fclose(o);
system("epstopdf susinploa.eps");
system( "open susinploa.pdf"); //for macintosh
getchar(); system("killall Preview"); // For macintosh
}
Latex generator of labels
\documentclass[12pt]{article}
\usepackage{geometry}
\usepackage{graphics}
\usepackage{rotating}
\newcommand \rot {\begin{rotate}}
\newcommand \ero {\end{rotate}}
\paperwidth 1026pt
\paperheight 345pt
\topmargin -109pt
\oddsidemargin -90pt
\newcommand \sx {\scalebox}
\pagestyle{empty}
\begin{document}
\begin{picture}(1016,328)
%\put(20,1){\includegraphics{susinplot1}}
\put(20,1){\includegraphics{susinploa}}
%\put(20,1){\includegraphics{04}}
\put(2,312){\sx{2.4}{$y$}}
\put(-1,257){\sx{2.8}{$\frac{\pi}{2}$}}
\put(2,198){\sx{2.4}{$1$}}
\put(2,98){\sx{2.4}{$0$}}
\put(15,-16){\sx{2.4}{$0$}}
\put(115,-16){\sx{2.4}{$1$}}
\put(215,-16){\sx{2.4}{$2$}}
\put(315,-16){\sx{2.4}{$3$}}
\put(415,-16){\sx{2.4}{$4$}}
\put(516,-16){\sx{2.4}{$5$}}
\put(616,-16){\sx{2.4}{$6$}}
\put(717,-16){\sx{2.4}{$7$}}
\put(817,-16){\sx{2.4}{$8$}}
\put(917,-16){\sx{2.4}{$9$}}
\put(1010,-16){\sx{2.5}{$x$}}
%\put(45,134){\sx{2.5}{$y\!=\!\mathrm{SuSin}(x)$}}
\put(190,246){\sx{1.8}{\rot{-12}$y\!=\! \sqrt{3/x}$\ero}}
\put(190,201){\sx{1.8}{\rot{-6}$y\!=\!\mathrm{SuSin}(x)$\ero}}
\put(190,176){\sx{1.8}{\rot{-6}$y\!=\!\exp((1\!-\!\sqrt{x})\ln(\pi/2))$\ero}}
\put(190,110){\sx{1.8}{\rot{-8}$y\!=\! 10\Big(\exp((1\!-\!\sqrt{x})\ln(\pi/2))-\mathrm{SuSin}(x)\Big)$\ero}}
\end{picture}
\end{document}
File history
Click on a date/time to view the file as it appeared at that time.
| Date/Time | Thumbnail | Dimensions | User | Comment | |
|---|---|---|---|---|---|
| current | 06:14, 1 December 2018 | 4,259 × 1,432 (460 KB) | Maintenance script (talk | contribs) | Importing image file |
- You cannot overwrite this file.
File usage
The following page links to this file: