File:2014.12.29fitA300.png

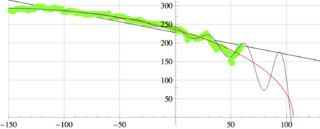
Price of 100 Russian roubles measured in the USA cents.
Abscissa is time, measured in days since the date 2014.10.27, that dorresponds to the beginning of the project,
The green dots correspond to the data by https://www.mataf.net/en/currency/converter-USD-RUB
The red monotonous line shows the approximation
$y=f_3(x)=1.11631 \sqrt{(106.006 - x) (419.029 + x)}$
the blue oscillating curve shows the approximation
$\displaystyle y=f_3(x)+6.3 \exp(0.028 x) \sin\big(\frac{\pi}{16} (-54 + x)\big)$
Both approximations are made 2014.12.29. They approximate the experimental data for the range $-150<x<160$.
it will be interesting to see, how far will these functions approximate the experimental data for x>160.
File history
Click on a date/time to view the file as it appeared at that time.
| Date/Time | Thumbnail | Dimensions | User | Comment | |
|---|---|---|---|---|---|
| current | 06:09, 1 December 2018 | 1,500 × 603 (100 KB) | Maintenance script (talk | contribs) | Importing image file |
- You cannot overwrite this file.
File usage
There are no pages that link to this file.