File:2015.01.01rudo.png

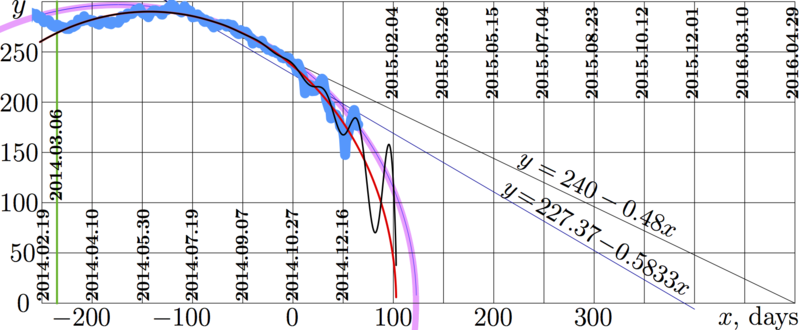
2015.01.01rudo is explicit plot of value of 100 Russian roubles, evaluated in the USA cents, versus time $x$, measured in days since the beginning of the project, 2014.10.27.
This figure is similar to figure http://mizugadro.mydns.jp/t/index.php/File:2014.12.31rudo.png with the following modifications:
Original data are taken from another source, namely, from
www.cbr.ru/scripts/XML_dynamic.asp?date_req1=01/01/2014&date_req2=31/12/2014&VAL_NM_RQ=R01235
These data are shown with light blue line, instead of green in the case of http://mizugadro.mydns.jp/t/index.php/File:2014.12.31rudo.png ; the colour changed in order to make the overlapping of this two images more spectacular and simiplify the comparison.
The field of the plot is extended for the negative values of time $x$; the data for the full year are loaded.
Not all the data are available; data for some daysare missed in the original (in particular, those for saturdays and sundays). Totally, $N\!=\!247$ data are loaded as $y=F_n$ for $1\le n\le N$, and they correspond to values of time $x=X_n$.
For the analysis, the data since 2014.03.05 are used, so, the first point take into account, fitting the data, is $x\!=\!-235$; this coordinate is marked with green vertical line. In order to show the limit of approximation, some more data are plotted also at the left hand side of this vertical line.
The thick pink arc and the straight lines are reproduced from figure http://mizugadro.mydns.jp/t/index.php/File:2014.12.31rudo.png ; these lines represent the previous estimates.
The red ellipse represents the fit
$y=g(x)=1.18052 \sqrt{(102.851 - x) (388.552 + x)}$
The black oscillating curve represents the improved fit
$y=h(x)=g(x)+2.34457 \exp(0.0379563 x) \sin\big(0.190307 (-54.7326 + x)\big)$
These fits are similar to those in figure File:2014.12.31rudo.png
For the fit $h$, the mean deviation $D$ and the mean square deviation $Q$ are estimated as follows:
$\displaystyle D= \frac{1}{K}\sum_{n=k}^N \big|F_n-h(X_n)\big|\approx 3.16919$
$\displaystyle Q=\sqrt{ \frac{1}{K} \sum_{n=k}^N \big(F_n-h(X_n)\big)^2 } \approx 4.28327 $
where $K=N-k+1=208$ is total number of data taken into account in the optimisation of fit $h$, and $k$ is number of the first datum taken into account.
Acknowledgement
References
http://www.cbr.ru Центральный банк Российской Федерации
http://cbr.ru/hd_base/default.aspx?Prtid=mrrf_7d
Международные резервы Российской Федерации. Еженедельные значения на конец отчетной даты
млрд. долл. США
Дата Объем
26.12.2014 388,5
19.12.2014 398,9
12.12.2014 414,6
05.12.2014 416,2
28.11.2014 420,5
21.11.2014 420,4
14.11.2014 420,6
07.11.2014 421,4
File history
Click on a date/time to view the file as it appeared at that time.
| Date/Time | Thumbnail | Dimensions | User | Comment | |
|---|---|---|---|---|---|
| current | 06:09, 1 December 2018 | 1,660 × 684 (215 KB) | Maintenance script (talk | contribs) | Importing image file |
- You cannot overwrite this file.
File usage
There are no pages that link to this file.