File:2021.12.06.CovidBelarusForecasFragment.png

Fragment from image File:2021.12.06.CovidBelarusForecasFragment.png
The description is repeated below
Summary

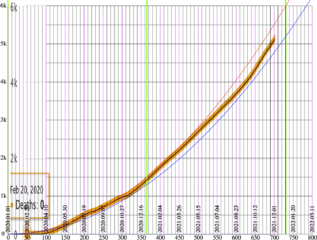
Covid death tall at Belarus versus time measured in days since 2020.01.01.
Orange strip: data by Worldometer[1]. This curve is shown in figure at right.
Black line: Data by ourworldindata[2] in csv format.
Description
Worldometer does not provide any easy way to extract the table used to plot the pictures presented there. In order to compare the worldometer data with those by other sources (that allow automatic extraction of numbers), the curves are plotted on the screenshot from worldometer. In order to reproduce the picture the screenshot from 2021.12.06 should be saved as 2021.12.06.bd7.png
The data by ourworldindata are extracted with command
grep Belarus ../owid-covid-data.csv |cut -d, -f 3,4,8 > Belarus.txt
For the comparison, these data can be combined with code copypasted in the next section.
Generation
For generation of the picture, the screenshot 2021.12.06.bd7.png by Worldometer
[1] should be loaded (it is shown above).
The input file Belarus.txt mentioned above also should be loaded.
Then, the picture can be generated with the PHP code below:
<!DOCTRINE html><html><body><small><small><small>
<?php
$j0=juliantojd(1, 1, 2020);
for($T=0;$T<1001;$T++) $P[$T]=0;

$myfile = fopen("Belarus.txt", "r") or die("Unable to open file!");
for($i=0;$i<1001;$i++){ $g=fgets($myfile);
                        $h=explode(",",trim($g));
                        $s=count($h); if($s<2) break;
                        $s=strlen($h[2]);
                        $f=explode("-",$h[1]);
                        $j=juliantojd($f[1], $f[2], $f[0]);
                        if($s>1){ $T=$j-$j0; // echo "$h[1] $t $h[2] ";
                                  $u=sscanf($h[2],"%d"); $v=$u[0];    // echo $v,"<br>\n";
                                  $P[$T]=$v; }
                }
fclose($myfile);
$U=$T+1; echo "Belarus tall for U=$U days<br>";   //  for($T=0;$T<$U;$T++) { echo "$T,$P[$T] <br>" ;}

echo "<svg width='852'; height='800';>";
#echo "<image x='-38' y='88' preserveAspectRatio='none' width='722' height='170' xlink:href='2021.12.06.bd.png'/>";
#echo "<image x='32' y='8' preserveAspectRatio='none' width='712' height='792' xlink:href='2021.12.06.bd7.png'/>";
echo "<image x='26' y='8' preserveAspectRatio='none' width='712' height='792' xlink:href='2021.12.06.bd7.png'/>";
#$L=36;
#$L=26;
$L=20;
$B=620;
for($y=0;$y<601;$y+=50) { $x1=$L+100; $x2=$L+800; $Y=$B-$y;
echo "<line x1=$x1 y1=$Y x2=$x2 y2=$Y stroke='black' stroke-width='.6'/>\n";}

$y=600; $Y=$B+4-$y; echo "<text transform='translate(0,$Y)'>6k </text> \n";
$y=500; $Y=$B+4-$y; echo "<text transform='translate(0,$Y)'>5k </text> \n";
$y=400; $Y=$B+4-$y; echo "<text transform='translate(0,$Y)'>4k </text> \n";
$y=300; $Y=$B+4-$y; echo "<text transform='translate(0,$Y)'>3k </text> \n";
$y=200; $Y=$B+4-$y; echo "<text transform='translate(0,$Y)'>2k </text> \n";
$y=100; $Y=$B+4-$y; echo "<text transform='translate(0,$Y)'>1k </text> \n";
$y=0  ; $Y=$B+4-$y; echo "<text text-anchor='end' transform='translate(11,$Y)'> 0 </text> \n";

for($t=0;$t<4;$t++){    $T=365.25*$t; $X=$L+$T;
                        echo "<line x1=$X y1=$B x2=$X y2=0 stroke='RGB(0,255,0)' stroke-width='3'/>\n";
                }

for($T=0;$T<801;$T+=10){$X=$L+$T; $Y1=$B; $Y2=$B-600;
 echo "<line x1=$X y1=$Y1 x2=$X y2=$Y2 stroke='black' stroke-width='.5'/>\n"; }

$B4=$B+4;
for($T=0;$T<801;$T+=50)
{
 $X=$L+$T;
 $X1=$L+$T+1;
 $Xp=$X+5;
 $j=$j0+$T;
$d0=jdtojulian($j);
$d1=explode("/",$d0);
$text=sprintf("%04d.%02d.%02d",$d1[2],$d1[0],$d1[1]);
$tex=sprintf("%d",$T);
$B1=$B-40;
$B2=$B+14;
echo "<line x1=$X y1=30 x2=$X y2=$B4 stroke='RGB(255,0,255)' stroke-width='.9' />\n";
echo "<text text-anchor='middle' transform='translate($Xp,$B1) rotate(-90)'>$text</text> \n";
echo "<text text-anchor='middle' transform='translate($X1,$B2)'>$tex</text> \n";
}

echo "<polyline points='\n";
for($T=0;$T<$U;$T++) {  $X=$L+$T;
                        $Y=$B - 0.1 * $P[$T];
                        echo "$X,$Y "; }
echo "'"; echo " style='fill:none;stroke:#000;stroke-width:1.6' /> \n";

echo "<polyline points='\n";
for($T=0;$T<811;$T++) { $X=$L+$T;
                        $t=$T/365.25;
                        $Y=$B - 0.1 *1500*$t*$t;
                        echo "$X,$Y "; }
echo "'"; echo " style='fill:none;stroke:#f00;stroke-width:1' /> \n";

echo "<polyline points='\n";
for($T=0;$T<811;$T++) { $X=$L+$T;
                        $t=$T/365.25;
                        $Y=$B - 0.1 *1300*$t*$t;
                        echo "$X,$Y "; }
echo "'"; echo " style='fill:none;stroke:#00f;stroke-width:1' /> \n";

echo "</svg>";
echo "</small>\n";
?>
</body>
</html>
Approximations
The reasonable agreement between data by Wordometer and those by ourworldindata is seen. It seems to be small compare to the width of the orange strip provided by the Worldometer. FOr this reason, both sets of the data can be approximated at once.
Here I describe the two primitive approximations. They are based on observation, that the "daily death cases" for Covid at Belarus show stable and almost linear growth. Hence the simple approximation should be quadratic. The first explosions ат Новосибирск that could rise the spreading of Covid are dated 2019.08.16 [3] and 2019.09.16.Взрыв [4]. In both cases, the victims, to together with their colleagues, their relatives, their friends and their neighbors dead before they could give any explanations to correspondents; the journalists could not get information even about names of the victims. For this reason, these explosions ca be considered as origin of the epidemic of respiratory illness, reported in Russia 2019 October [5][6].
Since 2019 December, the respiratory illness is reported at China, and then, since the beginning of 2020, in other countries, including Belarus.
The minima of parabolas used in the approximations is chosen at the beginning of year 2020. Such a quadratic approximation looks good: the intermediate parabola crosses the experimental curves several times; this indicates, the "analytic" properties of the experimental curve are already well captured by the simple approximation, and there is no need to itroduce an additional adjusting parameter to improve the approximation.
The picture venerated with code above provides the two simple approximations, pessimistic (red curve) and optimistic (blue curve).
These curves are plotted by the following formulas:
\( f(t)=1500\, t^2 \)
and
\( f(t)=1300\, t^2 \)
Here \(f(t)\) is total Covid death tall for Belarus; and
time \(t\) is measured in years since 2021.01.01; it is assumed, that one year is 365.25 days:
\(f(t)=F(T)=F(365.25 \, t) \)
where \(T\) is time measured in days. \(T \) is proportional to \(t\) ; for the positive values, \(T \) is bigger than \(t\), \(T > t\).
However, the quadratic approximation of the Covid case is typical for the "stable" countries (countries of stagnation); mainly in Russia and some Russia's neighbors, including Belarus. In other countries, the growth of number of the Covid cases (and number of the lethal cases) is less regular, and does not allow the simple approximation with few parameters (and, in this sense, is less predictable).
Historic context
The approximations can be treated as extrapolations. They imply, that after 80years, at the end of century 21, the Covid death tall exceeds the total population of Belarus. Perhaps, the the range of validity of the approximations is much shorter, than 80 years since the generation.
References
- ↑ 1.0 1.1 https://www.worldometers.info/coronavirus/country/belarus/ WORLD / COUNTRIES / BELARUS Last updated: December 06, 2021, 06:44 GMT ..
- ↑ https://covid.ourworldindata.org/data/owid-covid-data.csv 2021 Dec 5 12:23 JST
- ↑ https://nsk.aif.ru/incidents/v_novosibirske_na_predpriyatii_proizoshel_vzryv Новосибирск, 16 августа - АиФ-Новосибирск. (2019) Сегодня в девять утра взрыв случился в Кировском районе на ул. Горбаня, на территории предприятия, занимающегося приемом и утилизацией металлолома. Погиб 45-летний газорезчик, который распиливал прибывшие на утилизацию танковые артиллерийские снаряды калибром 115 мм . Об этом сообщает сайт единой дежурно-диспетчерской службы Новосибирска.
- ↑ https://ngs.ru/text/incidents/2019/09/16/66236344/ В центре вирусологии «Вектор» произошёл взрыв — пострадал один человек, 16 СЕНТЯБРЯ 2019, 18:07. Сейчас на месте работают спасатели МЧС
- ↑ https://ria56.ru/posts/v-orenburge-vosem-shkolnyx-klassov-ostayutsya-na-karantine.htm В ОРЕНБУРГЕ ВОСЕМЬ ШКОЛЬНЫХ КЛАССОВ ОСТАЮТСЯ НА КАРАНТИНЕ 14:43 / 01.10.2019 По состоянию на 1 октября занятия из-за карантина не возобновили восемь классов в трех школах Оренбурга. Дистанционно продолжают обучаться 227 детей. По информации управления образования администрации города, уроки на дому получают ученики школ №3, 67 и 76. Занятия отменили, чтобы избежать распространения ОРВИ среди детей. Оренбургское управление Роспотребнадзора сообщает, что школьники в этом учебном году в основном болеют риновирусами и другими вирусами негриппозной этиологии. Детские сады Оренбурга не остановили работу. Их воспитанники продолжают туда ходить, закрытых групп нет.
- ↑ https://ria56.ru/posts/v-orenburge-vosem-shkolnyx-klassov-ostayutsya-na-karantine.htm В ОРЕНБУРГЕ ВОСЕМЬ ШКОЛЬНЫХ КЛАССОВ ОСТАЮТСЯ НА КАРАНТИНЕ 14:43 / 01.10.2019 По состоянию на 1 октября занятия из-за карантина не возобновили восемь классов в трех школах Оренбурга. Дистанционно продолжают обучаться 227 детей. По информации управления образования администрации города, уроки на дому получают ученики школ №3, 67 и 76. Занятия отменили, чтобы избежать распространения ОРВИ среди детей. Оренбургское управление Роспотребнадзора сообщает, что школьники в этом учебном году в основном болеют риновирусами и другими вирусами негриппозной этиологии. Детские сады Оренбурга не остановили работу. Их воспитанники продолжают туда ходить, закрытых групп нет.
File history
Click on a date/time to view the file as it appeared at that time.
| Date/Time | Thumbnail | Dimensions | User | Comment | |
|---|---|---|---|---|---|
| current | 19:09, 6 December 2021 | | 1,459 × 1,104 (219 KB) | T (talk | contribs) | Fragment from image File:2021.12.06.CovidBelarusForecasFragment.png The description is repeated below <div style="margin:-2px -14px 0px -200px; background-color:#fff"> <div style="margin:2px 0px 0px 30px; line-height:1.2e,"> == Summary == <div style... |
- You cannot overwrite this file.
File usage
There are no pages that link to this file.