File:HADCRUT4 1988-2019 woodfortrees18.png

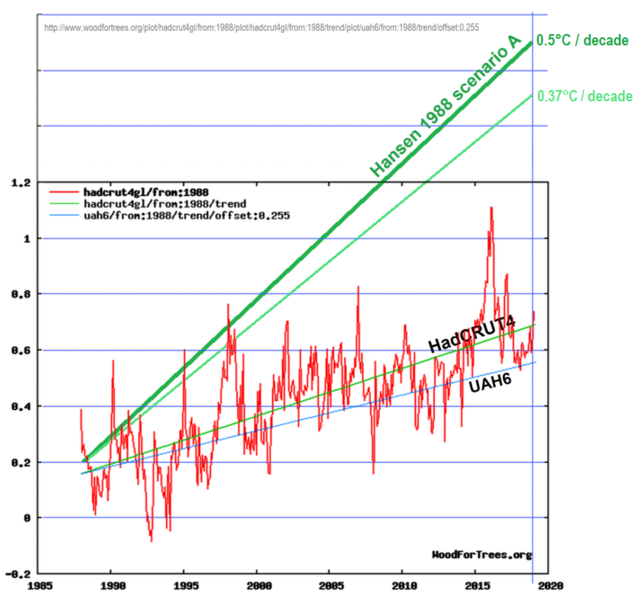
Comparison of forecast by James Hansen to the observed growth of averaged temperature in years 1983-2019 by [1].
Original filename: http://sealevel.info/HADCRUT4_1988-2019_woodfortrees18.png
Description
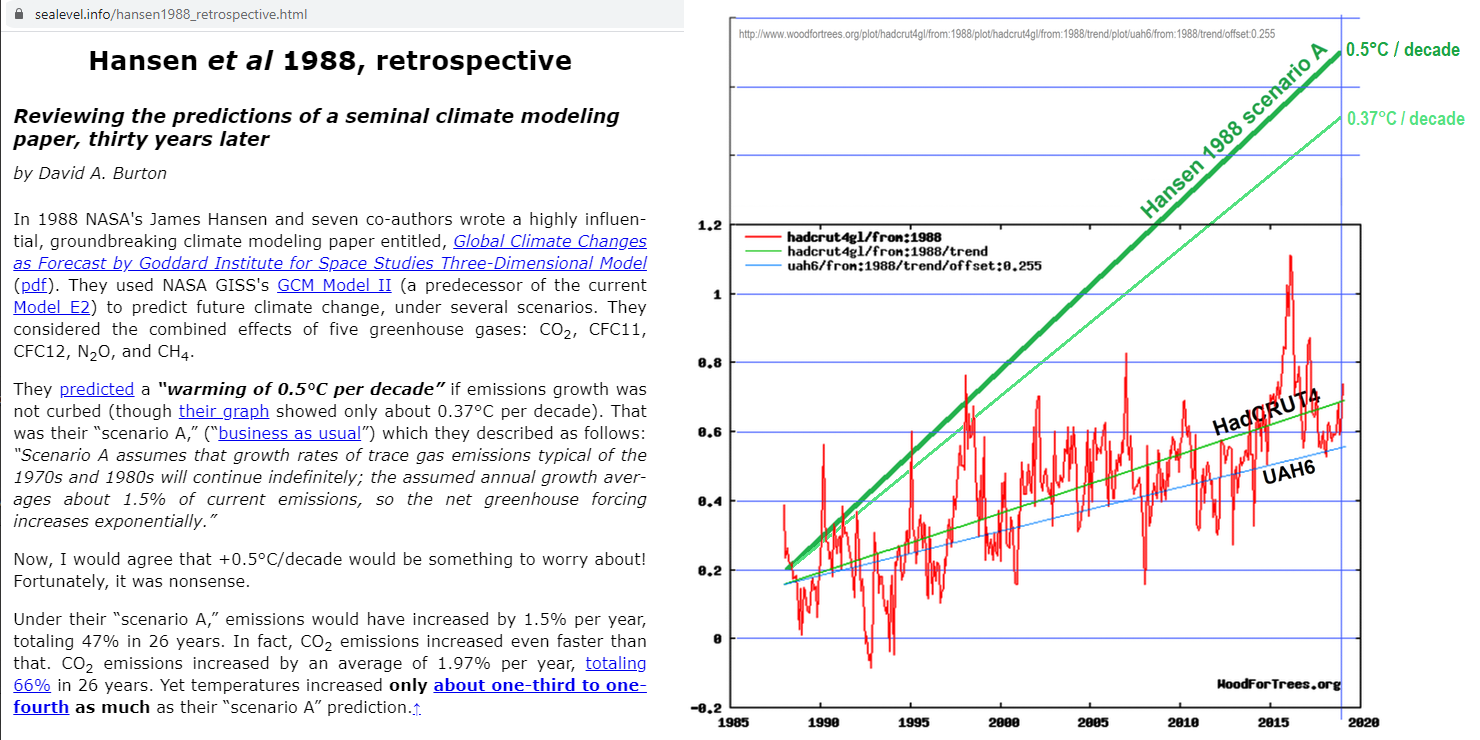
Hansen et al 1988, retrospective Reviewing the predictions of a seminal climate modeling paper, thirty years later March 7, 2018 (latest substantial revision December 9, 2019) by David A. Burton
In 1988 NASA's James Hansen and seven co-authors wrote a highly influential, groundbreaking climate modeling paper entitled, Global Climate Changes as Forecast by Goddard Institute for Space Studies Three-Dimensional Model (pdf). They used NASA GISS's GCM Model II (a predecessor of the current Model E2) to predict future climate change, under several scenarios. They considered the combined effects of five greenhouse gases: CO2, CFC11, CFC12, N2O, and CH4.
They predicted a “warming of 0.5°C per decade” if emissions growth was not curbed (though their graph showed only about 0.37°C per decade). That was their “scenario A,” (“business as usual”) which they described as follows: “Scenario A assumes that growth rates of trace gas emissions typical of the 1970s and 1980s will continue indefinitely; the assumed annual growth averages about 1.5% of current emissions, so the net greenhouse forcing increases exponentially.”
Now, I would agree that +0.5°C/decade would be something to worry about! Fortunately, it was nonsense.
Under their “scenario A,” emissions would have increased by 1.5% per year, totaling 47% in 26 years. In fact, CO2 emissions increased even faster than that. CO2 emissions increased by an average of 1.97% per year, totaling 66% in 26 years. Yet temperatures increased only about one-third to one-fourth as much as their “scenario A” prediction.↑
Graph contrasting Hansen 1988 Scenario A prediction with HadCRUT4 and UAH6
Even so, climate alarmists frequently claim that the NASA GISS model was “remarkably accurate.” Only in the massively politicized field of climatology could a 200% error be described as remarkably accurate. Even economists are embarrassed by errors that large.
Additionally, the Hansen et al claim that an annual 1.5% (i.e., exponential) increase in GHGs causes an exponential “net greenhouse forcing” was a mindbogglingly obvious blunder. Even in 1988 it was common knowledge that CO2 (the most important of the GHGs they discussed) has a logarithmically diminishing effect on temperature. So an exponential increase in CO2 level causes a less-than-exponential increase in forcing (asymptotically approaching linear). Yet, apparently none of those eight illustrious authors recognized that that claim was wrong.↑
Additionally, their “Scenario B” description was self-contradictory. They wrote that it was for, “decreasing trace gas growth rates, such that the annual increase of the greenhouse climate forcing remains approximately constant at the present level.” But, of course, if GHG growth rates had decreased, then the annual increase of greenhouse forcing would have also decreased.↑
In fact, it wasn't just their temperature projections which were wrong. Despite soaring CO2 emissions, even CO2 levels nevertheless rose more slowly than their “scenario A” prediction, because of the strong negative feedbacks which curbed CO2 level increases, a factor which Hansen et al did not anticipate. Although CO2 emissions increased by an average of 1.97%/year, CO2 levels increased by only about 0.5%/year.↑
Additionally, including an exponential increase in CFCs in their “business as usual” Scenario A was indefensible, because the Montreal Protocol had already been agreed upon in 1987, and the Vienna Convention back in 1985. It is impossible to imagine that Hansen, his seven co-authors, the peer-reviewers, and the editors, were all ignorant of those already-existing treaties, so there's no excuse for the paper nevertheless projecting exponential increases in CFCs, in any of their scenarios.↑
They obviously knew CFC emissions would be falling, not rising. Yet they promoted a “scenario” as “business as usual,” which they knew was actually impossible.
In other words, Hansen et al 1988 was wildly wrong about almost everything.†
IPCC founded
Most scientists are cautious about making predictions which are apt to embarrass them in the future. But Hansen et al 1988 had a purpose. It was the basis for Dr. Hansen's famous June 23, 1988 Congressional testimony. 5½ months after that testimony, and 3½ months after the paper was published, the United Nations created the Intergovernmental Panel on Climate Change, to combat the perceived threat — a threat which turns out to have been much ado about very little.↑
So, even though the authors got just about everything wrong in their paper, it was nevertheless a great success, because it accomplished what it was intended to accomplish. What did they learn from their mistakes?
Of course 1988 was a long time ago. So do you think perhaps they've gotten wiser?
I'm kidding, of course. The same people who say we should trust the current GCMs also uniformly but preposterously insist that the predictions of the older GCMs were pretty good. Here are examples from RC, SkS, and CarbonBrief; all three conflate CO2 levels with CO2 emissions, and then pretend that Hansen's “Scenario B” was the closest to reality. Their refusal to acknowledge the proven predictive failures of older models undermines their credibility w/r/t future predictions from newer models.
Despite the failures of his past dire predictions, Hansen remains one of the most strident alarmsts, e.g., with his very loud, very public, and thoroughly unscientific warnings about the peril of “extreme weather” due to anthropogenic climate change. He even published a book in 2009 entitled, Storms of My Grandchildren: The Truth About the Coming Climate Catastrophe and Our Last Chance to Save Humanity.
(The next time an apologist for climate alarmism claims that the “C” in “CAGW” is a straw-man invention of skeptics, show him the title of Hansen's book!)
In his book Hansen claimed (p.250) that global warming would warm higher latitude oceans less than lower latitudes, which would cause stronger storms. Page 250 is not part of the free preview on Amazon, but YouTube has a clip of Hansen on the Letterman Show on television, plugging his book and making the same claim, starting at 7 minutes 25 seconds: https://www.youtube.com/watch?v=SOKBOFLhgqM#t=7m25s
Hansen said that the “increasing temperature gradient [between high and low latitudes] is going to drive stronger storms,” as lower latitudes warm faster than higher latitudes. But it is now known that that prediction was exactly backwards.
His book is completely wrong. The reality is that in the northern hemisphere “polar amplification” causes extreme latitudes to warm much faster than most other places, and stabilizing negative feedbacks reduce warming in the tropics. So anthropogenic climate change causes a reduced temperature gradient, rather than increased.
Indeed, worldwide storminess actually seems to have decreased slightly, rather than increased, as greenhouse gas levels have gone up. Hurricanes & tropical cyclones have no clear trend, and tornadoes are trending slightly down:
..
(See also: doi: 10.1002/2017GL076071, https://www.woodtv.com/weather/bill-s-blog/strong-to-violent-tornado… [2], http://policlimate.com/tropical/global_running_ace.png, and https://wunderground.com/hurricane/accumulated_cyclone_energy.asp?ba…)
I hesitate to call the slight decline in tropical cyclones a trend, but severe tornadoes are certainly down. Yet Hansen and other prominent climate alarmists still won't admit that a benefit of anthropogenic climate change might be a reduction in extreme weather.
You've heard that “no news is good news?” Well, in climate science it's the converse: “good news is no news!” Climate alarmists and their allies in the press rarely report the good news, about reduced extreme weather, improved agricultural productivity, and a greening planet, thanks to anthropogenic CO2.
- # #
† I'm certainly not the first person to have noticed the large divergence between reality and the predictions of Hansen et al 1988. The most complete examination was probably that of Steve McIntylre, in 2008: https://climateaudit.org/2008/01/16/thoughts-on-hansen-et-al-1988/ Ross McKitrick and John Christy also examined it, in this excellent July 3, 2018 article:
https://judithcurry.com/2018/07/03/the-hansen-forecasts-30-years-later/ There have also been many attempts to defend Hansen et al 1988. They've generally used the strategy of pretending that “Scenario B” was the closest match to actual emissions, instead of “Scenario A” (“business as usual”). The strongest (still weak!) is probably this one, by Nick Stokes: https://moyhu.blogspot.com/2015/10/hansens-1988-predictions-revisited.html (and also these blog posts).
RC, Hausfather/CarbonBrief, Nuccitelli/SkS, & Nuccitelli/TheGuardian all made less competent attempts.
Here's the transcript of Dr. Hansen's 6/23/1988 Congressional testimony, and accompanying graph.
Permalink:
https://
tinyurl.com/hansen88 or
https://sealevel.info/hansen88
Unhyphenated: https://sealevel.info/hansen1988_retrospective2.html
Excerpt for twitter: https://sealevel.info/hansen1988_retrospective_excerpt_1480x740.png
Last modified: 12-Jun-2020 (version 35) Copyright © 2018-2020, David A. Burton. Note: the “last modified” date and version number on this web page are maintained automatically by TLIB Version Control.
References
- ↑ http://sealevel.info/hansen1988_retrospective.html David A. Burton. Reviewing the predictions of a seminal climate modeling paper, thirty years later. March 7, 2018. (latest substantial revision December 9, 2019)
File history
Click on a date/time to view the file as it appeared at that time.
| Date/Time | Thumbnail | Dimensions | User | Comment | |
|---|---|---|---|---|---|
| current | 23:10, 23 September 2020 | | 785 × 740 (228 KB) | T (talk | contribs) |
- You cannot overwrite this file.
File usage
The following 3 pages link to this file: