Difference between revisions of "File:2021.12.07.CovidRussiaD.png"
(→Approximation) |
(→Generator) |
||
| (One intermediate revision by the same user not shown) | |||
| Line 25: | Line 25: | ||
so, for the comparison, the screenshot is used. |
so, for the comparison, the screenshot is used. |
||
| − | + | Values by [[urworldindata]] |
|
<ref name="o"> |
<ref name="o"> |
||
https://covid.ourworldindata.org/data/owid-covid-data.csv |
https://covid.ourworldindata.org/data/owid-covid-data.csv |
||
| Line 32: | Line 32: | ||
should be saved as owid-covid-data.csv |
should be saved as owid-covid-data.csv |
||
| − | Then, the table |
+ | Then, the input table can be extracted with command |
grep Russia ../owid-covid-data.csv |cut -d, -f 3,4,8 > Russia.txt |
grep Russia ../owid-covid-data.csv |cut -d, -f 3,4,8 > Russia.txt |
||
| Line 134: | Line 134: | ||
Data by [[Worldometer]] and by [[Ourwordiindata]] show reasonable agreement: the deviation seem to be smaller than the width of the orange strip. For this reason, the approximations refer to both these curves. |
Data by [[Worldometer]] and by [[Ourwordiindata]] show reasonable agreement: the deviation seem to be smaller than the width of the orange strip. For this reason, the approximations refer to both these curves. |
||
| − | The three approximations |
+ | The three approximations are the power function |
\( f(t) = c\, t^{5/2} \) |
\( f(t) = c\, t^{5/2} \) |
||
Latest revision as of 00:36, 8 December 2021
Covid death toll in Russia versus time \(T\) measured in days:
Curve by Worldometer [1], orange strip.
Curve by values by Ourworldindata [2], black line
and the three approximations (pessimistic, red; intermediate, green and optimistic, blue).
Generator
For generation of the picture, the screenshot  by Worldometer [1]
should be saved as
2021.12.06.CovidRussiaWd.png
Worldometer provides no table of values shown in the picture;
so, for the comparison, the screenshot is used.
Values by urworldindata [2] should be saved as owid-covid-data.csv
Then, the input table can be extracted with command
grep Russia ../owid-covid-data.csv |cut -d, -f 3,4,8 > Russia.txt
Then, the PHP program below can be executed:
<!DOCTRINE html><html><body><small>
<?php
$j0=juliantojd(1, 1, 2020);
for($T=0;$T<1001;$T++) $P[$T]=0;

$myfile = fopen("Russia.txt", "r") or die("Unable to open file!");
for($i=0;$i<1001;$i++){ $g=fgets($myfile);
                        $h=explode(",",trim($g));
                        $s=count($h); if($s<2) break;
                        $s=strlen($h[2]);
                        $f=explode("-",$h[1]);
                        $j=juliantojd($f[1], $f[2], $f[0]);
                        if($s>1){ $T=$j-$j0; // echo "$h[1] $t $h[2] ";
                                  $u=sscanf($h[2],"%d"); $v=$u[0];    // echo $v,"<br>\n";
                                  $P[$T]=$v; }
                }
fclose($myfile);
$U=$T+1; echo "Russia death tall for U=$U days<br>";   //  for($T=0;$T<$U;$T++) { echo "$T,$P[$T] <br>" ;}

echo "<svg width='852'; height='500';>";
#echo "<image x='26' y='8' preserveAspectRatio='none' width='712' height='792' xlink:href='2021.12.06.bd7.png'/>";
#echo "<image x='26' y='8' preserveAspectRatio='none' width='712' height='392' xlink:href='2021.12.06.CovidRussiaWd.png'/>";
#echo "<image x='26' y='10' preserveAspectRatio='none' width='730' height='424' xlink:href='2021.12.06.CovidRussiaWd.png'/>";
echo "<image x='27' y='10' preserveAspectRatio='none' width='728' height='420' xlink:href='2021.12.06.CovidRussiaWd.png'/>";
$L=40;
$B=320;
for($y=0;$y<301;$y+=50){$x1=$L+100; $x2=$L+800; $Y=$B-$y;
			echo "<line x1=$x1 y1=$Y x2=$x2 y2=$Y stroke='black' stroke-width='.6'/>\n";}

$y=300; $Y=$B+4-$y; echo "<text transform='translate(0,$Y)'>300k </text> \n";
$y=200; $Y=$B+4-$y; echo "<text transform='translate(0,$Y)'>200k </text> \n";
$y=100; $Y=$B+4-$y; echo "<text transform='translate(0,$Y)'>100k </text> \n";
$y=0  ; $Y=$B+4-$y; echo "<text text-anchor='end' transform='translate(11,$Y)'> 0 </text> \n";

for($t=0;$t<4;$t++){    $T=365.25*$t; $X=$L+$T;
                        echo "<line x1=$X y1=$B x2=$X y2=0 stroke='RGB(0,255,0)' stroke-width='2'/>\n"; }

for($T=0;$T<801;$T+=10){$X=$L+$T; $Y1=$B; $Y2=$B-300;
 echo "<line x1=$X y1=$Y1 x2=$X y2=$Y2 stroke='black' stroke-width='.5'/>\n"; }

$B4=$B+4;
for($T=0;$T<801;$T+=50){$X=$L+$T;
			$X1=$L+$T+1;
			$Xp=$X+5;
			$j=$j0+$T;
			$d0=jdtojulian($j);
			$d1=explode("/",$d0);
			$text=sprintf("%04d.%02d.%02d",$d1[2],$d1[0],$d1[1]);
			$tex=sprintf("%d",$T);
			$B1=$B-40;
			$B2=$B+14;
			echo "<line x1=$X y1=30 x2=$X y2=$B4 stroke='RGB(255,0,255)' stroke-width='.9' />\n";
			echo "<text text-anchor='middle' transform='translate($Xp,$B1) rotate(-90)'>$text</text> \n";
			echo "<text text-anchor='middle' transform='translate($X1,$B2)'>$tex</text> \n"; }

echo "<polyline points='\n";
for($T=0;$T<$U;$T++) {  $X=$L+$T;
                        $Y=$B - 0.001 * $P[$T];
                        echo "$X,$Y "; }
echo "'"; echo " style='fill:none;stroke:#000;stroke-width:1.6' /> \n";

echo "<polyline points='\n";
for($T=0;$T<811;$T++) { $X=$L+$T;
                        $t=$T/365.25;
                        $Y=$B - 0.001 *60000*$t*$t*sqrt($t);
                        echo "$X,$Y "; }
echo "'"; echo " style='fill:none;stroke:#f00;stroke-width:1' /> \n";

echo "<polyline points='\n";
for($T=0;$T<811;$T+=10) { $X=$L+$T;
                        $t=$T/365.25;
                        $Y=$B - 0.001 *55000*$t*$t*sqrt($t);
                        echo "$X,$Y "; }
echo "'"; echo " style='fill:none;stroke:#0a0;stroke-width:1' /> \n";

echo "<polyline points='\n";
for($T=0;$T<811;$T+=10) { $X=$L+$T;
                        $t=$T/365.25;
                        $Y=$B - 0.001 *50000*$t*$t*sqrt($t);
                        echo "$X,$Y "; }
echo "'"; echo " style='fill:none;stroke:#00f;stroke-width:1' /> \n";

echo "</svg>";
echo "</small>\n";
?>
</body>
</html>
There is some problem with the size of font. For compatibility, the screenshot of the resulting picture is loaded.
Approximations
Data by Worldometer and by Ourwordiindata show reasonable agreement: the deviation seem to be smaller than the width of the orange strip. For this reason, the approximations refer to both these curves.
The three approximations are the power function
\( f(t) = c\, t^{5/2} \)
where \( t=T/365.25\) is time measured in years since 2020.01.01.
The three curves correspond to the following three values of the parameter
\( c = 60000 \)
\( c = 55000 \)
\( c = 50000 \)
References
- ↑ 1.0 1.1 https://www.worldometers.info/coronavirus/country/russia/ World / Countries / Russia Last updated: December 06, 2021, 11:05 GMT .. Total Coronavirus Deaths in Russia
- ↑ 2.0 2.1 https://covid.ourworldindata.org/data/owid-covid-data.csv 2021 Dec 7 23:14 JST
File history
Click on a date/time to view the file as it appeared at that time.
| Date/Time | Thumbnail | Dimensions | User | Comment | |
|---|---|---|---|---|---|
| current | 00:20, 8 December 2021 | 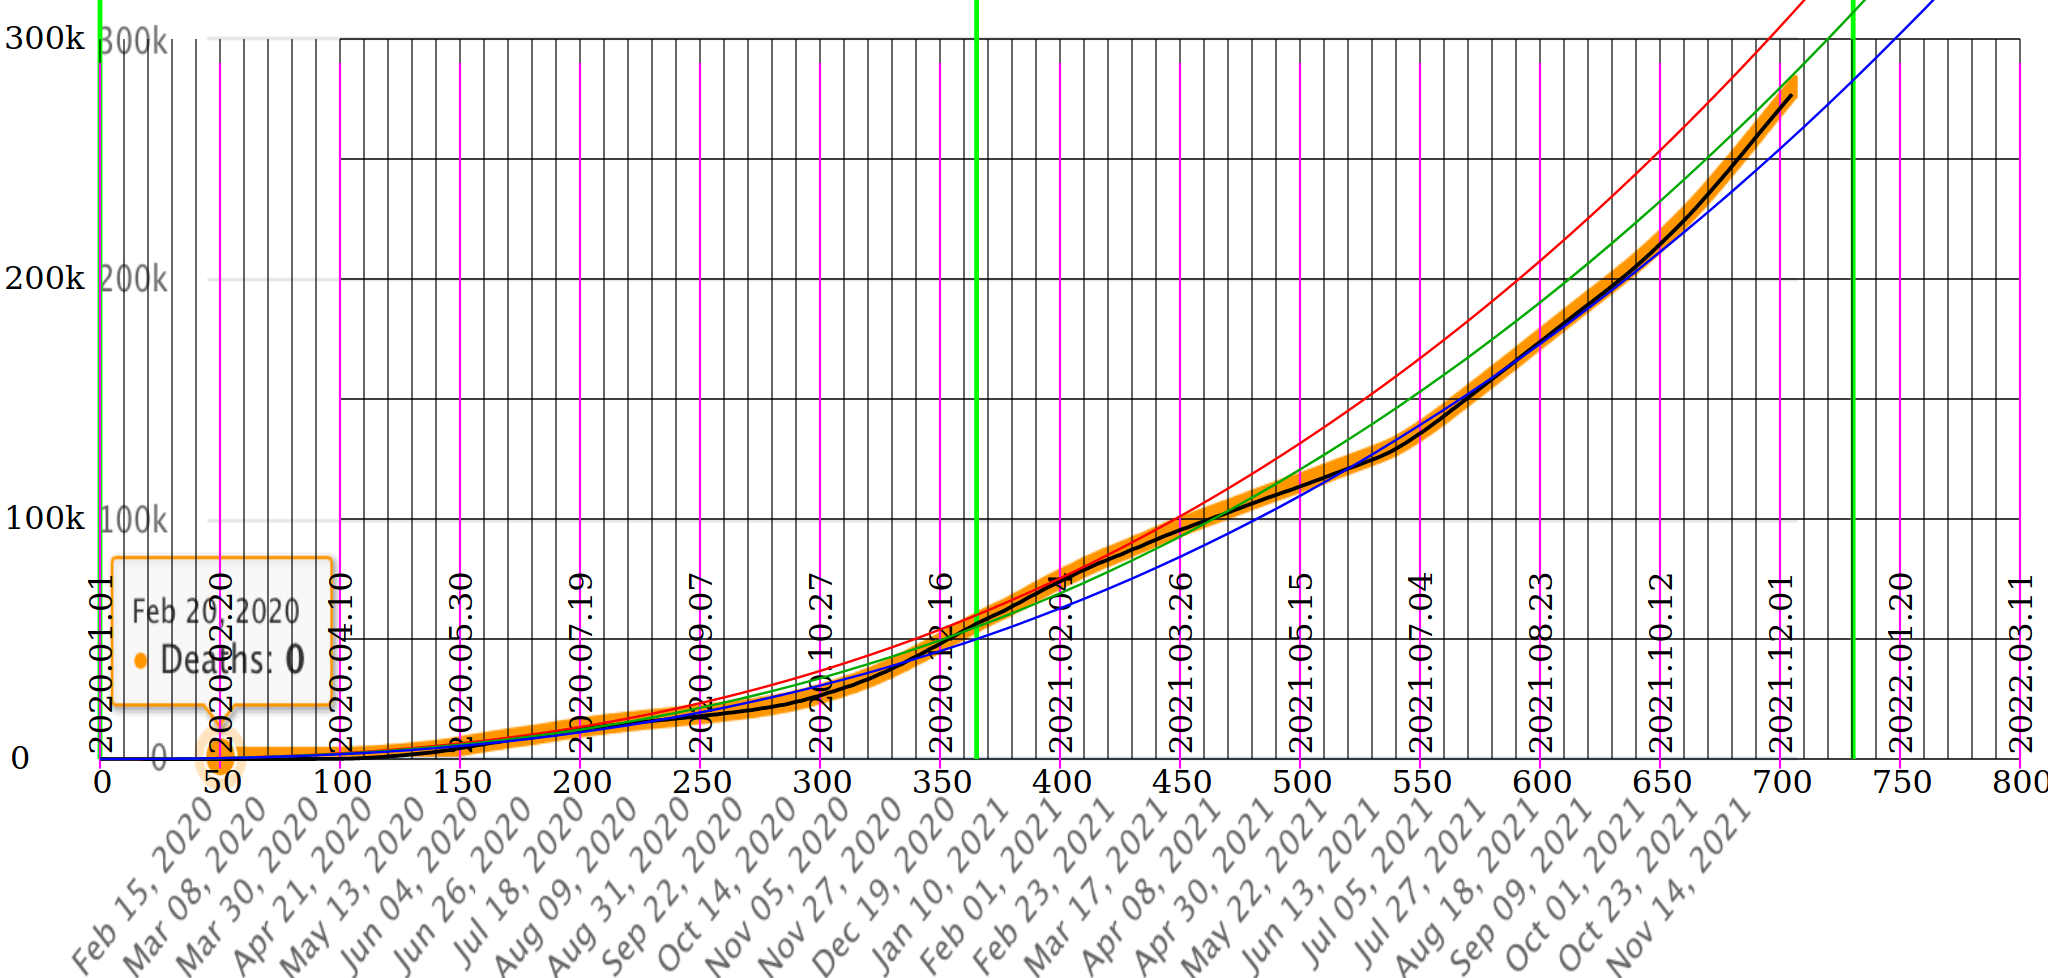 | 2,048 × 978 (344 KB) | T (talk | contribs) |
- You cannot overwrite this file.
File usage
The following page links to this file: