Difference between revisions of "File:Newton2011 7 27b.jpg"
(Importing image file) |
|||
| Line 1: | Line 1: | ||
| + | Map of contamination after the [[Fukushima disaster]]. |
||
| − | Importing image file |
||
| + | |||
| + | Colors represent the density $D(\alpha,\delta)$ of ionizing radiation measured from the aircrafts (airplanes helicopters) and recalculated for April 29, altitude one meter above the ground. |
||
| + | |||
| + | The view covers the range approximately $140.0<\delta<141.1$, $36.8<\alpha<38.0~$. |
||
| + | |||
| + | The intermediate blue represents the Pacific Ocean, that does not show its contamination at the aerial view. |
||
| + | |||
| + | The dark blue indicates the region with $D<1\mu \mathrm {Sv/h}$. |
||
| + | The following levels are shown: |
||
| + | : $1\mu$Sv/h, between dark blue and light blue. |
||
| + | : $1.9\mu$Sv/h, between light blue and green. |
||
| + | : $3.8\mu$Sv/h, between green and yellow |
||
| + | : $9.5\mu$Sv/h, between yellow and orange |
||
| + | : $19\mu$Sv/h, between orange and red |
||
| + | Maximal estimate for the red region is 91$\mu$Sv/h. |
||
| + | |||
| + | The high resolution image appeared 2011 May 26 at the |
||
| + | [[Newton Graphic Science Magazine]], 2011, issue 7, page27. |
||
| + | <ref name="newton"> |
||
| + | http://www.newtonpress.co.jp/science/newton |
||
| + | Map of contamination. [[Newton Graphic Science Magazine]], 2011, issue 7, page27</ref> |
||
| + | |||
| + | Similar image recalculated for levels of the concentration of rarioactivity in [[Becquerel]]/meter$^2$ is available at the [[MEXT]] cite |
||
| + | <ref name="mext"> |
||
| + | http://www.iaea.org/newscenter/news/tsunamiupdate01.html Fukushima Nuclear Accident Update Log. Staff Report, Updates of 12 - 18 May 2011; Last update: 23 May 2011. |
||
| + | </ref> |
||
| + | indicating that the recalculation uses the approximation |
||
| + | that the surface density of contaminants |
||
| + | $q= 1 $MegaBequerel/square meter causes |
||
| + | corresponds to the density if ionizing radiation |
||
| + | $D\approx 3.1$ microSievert per hour. |
||
| + | |||
| + | ==References== |
||
| + | <references/> |
||
| + | |||
| + | [[Category:Fukushima disaster]] |
||
| + | [[Category:Newton Graphic Science Magazine]] |
||
| + | [[Category:Maps]] |
||
| + | [[Category:Nuclear accidents]] |
||
| + | |||
| + | |||
| + | |||
| + | Red corresponds to den |
||
Latest revision as of 09:38, 21 June 2013
Map of contamination after the Fukushima disaster.
Colors represent the density $D(\alpha,\delta)$ of ionizing radiation measured from the aircrafts (airplanes helicopters) and recalculated for April 29, altitude one meter above the ground.
The view covers the range approximately $140.0<\delta<141.1$, $36.8<\alpha<38.0~$.
The intermediate blue represents the Pacific Ocean, that does not show its contamination at the aerial view.
The dark blue indicates the region with $D<1\mu \mathrm {Sv/h}$. The following levels are shown:
- $1\mu$Sv/h, between dark blue and light blue.
- $1.9\mu$Sv/h, between light blue and green.
- $3.8\mu$Sv/h, between green and yellow
- $9.5\mu$Sv/h, between yellow and orange
- $19\mu$Sv/h, between orange and red
Maximal estimate for the red region is 91$\mu$Sv/h.
The high resolution image appeared 2011 May 26 at the Newton Graphic Science Magazine, 2011, issue 7, page27. [1]
Similar image recalculated for levels of the concentration of rarioactivity in Becquerel/meter$^2$ is available at the MEXT cite [2] indicating that the recalculation uses the approximation that the surface density of contaminants $q= 1 $MegaBequerel/square meter causes corresponds to the density if ionizing radiation $D\approx 3.1$ microSievert per hour.
References
- ↑ http://www.newtonpress.co.jp/science/newton Map of contamination. Newton Graphic Science Magazine, 2011, issue 7, page27
- ↑ http://www.iaea.org/newscenter/news/tsunamiupdate01.html Fukushima Nuclear Accident Update Log. Staff Report, Updates of 12 - 18 May 2011; Last update: 23 May 2011.
Red corresponds to den
File history
Click on a date/time to view the file as it appeared at that time.
| Date/Time | Thumbnail | Dimensions | User | Comment | |
|---|---|---|---|---|---|
| current | 17:50, 20 June 2013 | 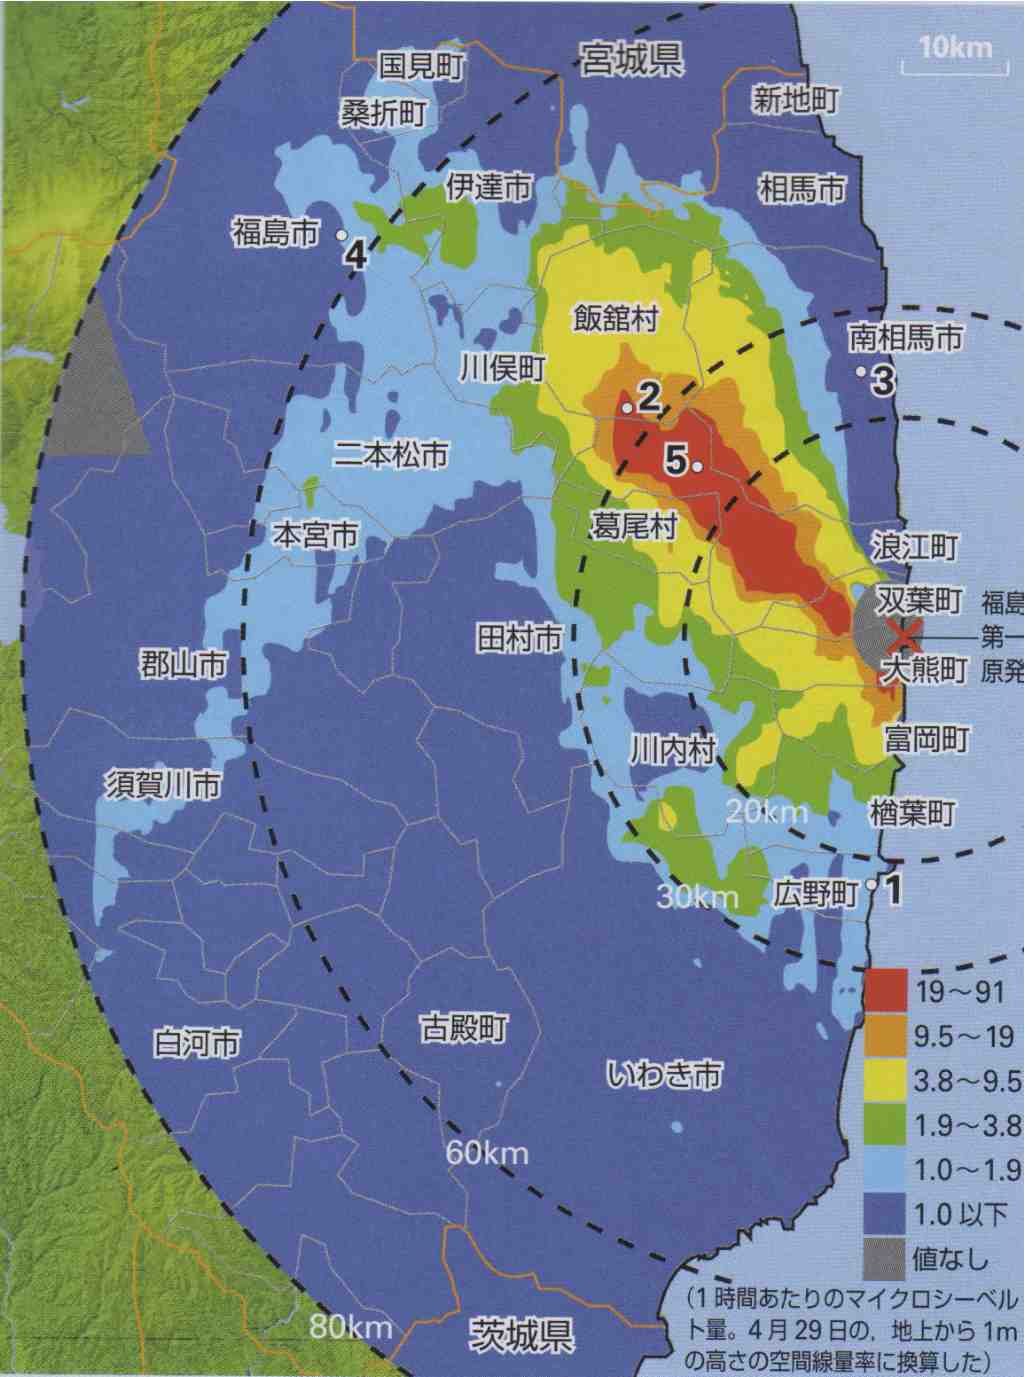 | 1,025 × 1,377 (81 KB) | Maintenance script (talk | contribs) | Importing image file |
You cannot overwrite this file.
File usage
The following 4 pages use this file: