Difference between revisions of "File:IterPowPlotT.png"
(no book, this is old version) |
|||
| Line 133: | Line 133: | ||
%</nowiki></nomathjax></poem> |
%</nowiki></nomathjax></poem> |
||
| − | [[Category:Book]] |
||
[[Category:Power function]] |
[[Category:Power function]] |
||
[[Category:Iteration]] |
[[Category:Iteration]] |
||
Latest revision as of 20:50, 28 September 2013
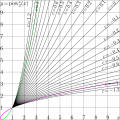
Explicit plot of $c$th Iteration of the quadratic function, id est, power function for power 2; $y=\mathrm{Pow}_2^{~c}(z)=T^c(x)~$ for various values of number $c$ of iteration. Here,
- $\!\!\!\!\!\!\!\!\!\!\ (1) ~ ~ ~ T(z)=\mathrm{Pow}_2(z)=z^2=\exp\Big(\ln(z)\,2\Big)$
The iteration of $T$ is implemented in the following way:
- $\!\!\!\!\!\!\!\!\!\!\ (2) ~ ~ ~y=T^c(x)={\mathrm{Pow}_2}^c(z)=F\Big(c+G(x)\Big)$
where
- $\!\!\!\!\!\!\!\!\!\!\ (3) ~ ~ ~ F(z)=\exp\Big( \exp\big( \ln(2)\, z\big)\Big)$
is superfunction for the transfer function $T$ and
- $\!\!\!\!\!\!\!\!\!\!\ (4) ~ ~ ~G(z)=\ln\Big( \ln(z) \Big)/ \ln(2)$
is the Abel Function.
The thick lines represent $y=x^2$ and $y=\sqrt{x}$. FIrst of them overlaps with $y=T^1(x)$ and corresponds to $c\!=\!1$, and the second overlaps with $y=T^{-1}(x)$ and corresponds to $c\!=\!-1$.
Warning
For
- $\!\!\!\!\!\!\!\!\!\!\ (5) ~ ~ ~T(z)=\mathrm{Pow}_b(z)=z^b$
the iterate can be expressed in the closed form through the same function. For other functions, such a representation may be not available.
C++ Generator of curves
#include<math.h>
#include<stdio.h>
#include<stdlib.h>
#define DB double
#define DO(x,y) for(x=0;x<y;x++)
using namespace std;
#include <complex>
typedef complex<double> z_type;
#define Re(x) x.real()
#define Im(x) x.imag()
#define I z_type(0.,1.)
#include "ado.cin"
DB B=2.;
DB F(DB z) { return exp( exp( log(B)*z));}
DB G(DB z) { return log( log(z) )/log(B);}
main(){ int m,n; double x,y,t; FILE *o;
o=fopen("IterPowPlot.eps","w"); ado(o,1010,1010);
fprintf(o,"1 1 translate 100 100 scale\n");
#define M(x,y) fprintf(o,"%6.3f %6.3f M\n",0.+x,0.+y);
#define L(x,y) fprintf(o,"%6.3f %6.3f L\n",0.+x,0.+y);
for(m=0;m<11;m++) {M(m,0)L(m,10)}
for(m=0;m<11;m++) {M(0,m)L(10,m)}
fprintf(o,"2 setlinecap .01 W S\n");
DO(m,42){x=0.001+.1*m; y=exp(2.*log(x)); if(m==0)M(x,y) else L(x,y);} fprintf(o,"1 setlinecap 1  setlinejoin .04 W 0 1 0 RGB S\n");
DO(m,1002){x=0.001+.01*m; y=exp(.5*log(x)); if(m==0)M(x,y) else L(x,y);} fprintf(o,"1 setlinecap 1 setlinejoin .04 W 1 0 1 RGB S\n");
for(n=-12;n<13;n++){t=.1*n; DO(m,92){x=1+.1*m; y=F(t+G(x)); if(m==0) M(x,y) else L(x,y); if(y>10.1)break;} }
fprintf(o,"1 setlinecap 1 setlinejoin .02 W 0 0 0 RGB S\n");
fprintf(o,"showpage\n%c%cTrailer",'%','%'); fclose(o);
      system("epstopdf IterPowPlot.eps");
      system(    "open IterPowPlot.pdf");
      getchar(); system("killall Preview");
}
Latex Generator of labels
% file IterPowPlot.pdf should be generated with the code above in order to compile the Latex document below. %
% Copyleft 2012 by Dmitrii Kouznetsov
%
\documentclass[12pt]{article} % <br>
\usepackage{geometry} % <br>
\usepackage{graphicx} % <br>
\usepackage{rotating} % <br>
\paperwidth 1008pt % <br>
\paperheight 1008pt % <br>
\topmargin -94pt % <br>
\oddsidemargin -81pt % <br>
\textwidth 1100pt % <br>
\textheight 1100pt % <br>
\pagestyle {empty} % <br>
\newcommand \sx {\scalebox} % <br>
\newcommand \rot {\begin{rotate}} % <br>
\newcommand \ero {\end{rotate}} % <br>
\newcommand \ing {\includegraphics} % <br>
\parindent 0pt% <br>
\pagestyle{empty} % <br>
\begin{document} % <br>
\begin{picture}(1002,1002) % <br>
\put(10,10){\ing{IterPowPlot}} % <br>
\put(11,976){\sx{4}{$y\!=\!\mathrm{pow}_2^c(x)$}} % <br>
\put(11,898){\sx{4}{$9$}} % <br>
\put(11,798){\sx{4}{$8$}} % <br>
\put(11,698){\sx{4}{$7$}} % <br>
\put(11,598){\sx{4}{$6$}} % <br>
\put(11,498){\sx{4}{$5$}} % <br>
\put(11,398){\sx{4}{$4$}} % <br>
\put(11,298){\sx{4}{$3$}} % <br>
\put(11,198){\sx{4}{$2$}} % <br>
\put(11,098){\sx{4}{$1$}} % <br>
% <br>
\put(100,16){\sx{4}{$1$}} % <br>
\put(200,16){\sx{4}{$2$}} % <br>
\put(301,16){\sx{4}{$3$}} % <br>
\put(401,16){\sx{4}{$4$}} % <br>
\put(502,16){\sx{4}{$5$}} % <br>
\put(602,16){\sx{4}{$6$}} % <br>
\put(703,16){\sx{4}{$7$}} % <br>
\put(803,16){\sx{4}{$8$}} % <br>
\put(903,16){\sx{4}{$9$}} % <br>
\put(990,16){\sx{4}{$x$}} % <br>
% <br>
\put(256,790){\sx{3.6}{\rot{84}$c\!=\!1.2$\ero}} % <br>
\put(325,921){\sx{3.6}{\rot{81}$c\!=\!1$\ero}} % <br>
\put(461,893){\sx{3.6}{\rot{70}$c\!=\!0.6$\ero}} % <br>
\put(509,894){\sx{3.6}{\rot{69}$c\!=\!0.5$\ero}} % <br>
\put(564,895){\sx{3.6}{\rot{63}$c\!=\!0.4$\ero}} % <br>
\put(630,897){\sx{3.6}{\rot{59}$c\!=\!0.3$\ero}} % <br>
\put(713,900){\sx{3.6}{\rot{54}$c\!=\!0.2$\ero}} % <br>
\put(826,913){\sx{3.6}{\rot{50}$c\!=\!0.1$\ero}} % <br>
% <br>
\put(928,932){\sx{3.6}{\rot{45}$c\!=\!0$\ero}} % <br>
% <br>
\put(894,778){\sx{3.6}{\rot{39}$c\!=\!-0.1$\ero}} % <br>
\put(888,676){\sx{3.6}{\rot{33}$c\!=\!-0.2$\ero}} % <br>
\put(887,599){\sx{3.6}{\rot{28}$c\!=\!-0.3$\ero}} % <br>
\put(877,528){\sx{3.6}{\rot{24}$c\!=\!-0.4$\ero}} % <br>
\put(871,477){\sx{3.6}{\rot{19}$c\!=\!-0.5$\ero}} % <br>
\put(870,429){\sx{3.6}{\rot{17}$c\!=\!-0.6$\ero}} % <br>
% <br>
\put(890,299){\sx{3.6}{\rot{6}$c\!=\!-1$\ero}} % <br>
\put(866,240){\sx{3.6}{\rot{5}$c\!=\!-1.2$\ero}} % <br>
\end{picture} % <br>
\end{document} % <br>
%
File history
Click on a date/time to view the file as it appeared at that time.
| Date/Time | Thumbnail | Dimensions | User | Comment | |
|---|---|---|---|---|---|
| current | 17:50, 20 June 2013 |  | 2,093 × 2,093 (680 KB) | Maintenance script (talk | contribs) | Importing image file |
You cannot overwrite this file.
File usage
The following page uses this file: