Difference between revisions of "2014.12.26rubleDollar"
m (Text replacement - "\$([^\$]+)\$" to "\\(\1\\)") |
|||
| Line 6: | Line 6: | ||
The |
The |
||
The green thick curve represents the experimental data |
The green thick curve represents the experimental data |
||
| − | + | \(y=g(x)=\mathrm{Measured}(x)\) |
|
by https://www.mataf.net/en/currency/converter-USD-RUB ; |
by https://www.mataf.net/en/currency/converter-USD-RUB ; |
||
| − | coordinate |
+ | coordinate \(x\) has sense of time, measured in days since the date of beginning of the project, |
2014,10,27. |
2014,10,27. |
||
| − | For each datum stored for specified year,month,day, the time |
+ | For each datum stored for specified year,month,day, the time \(x\) is evaluated as |
| − | + | \(x = \rm |
|
daju24(year,month, day)- |
daju24(year,month, day)- |
||
| − | daju24(2014,10, 27) |
+ | daju24(2014,10, 27)\) |
with function daju24 defined below in C++: |
with function daju24 defined below in C++: |
||
| Line 26: | Line 26: | ||
</poem> |
</poem> |
||
| − | These data are stored as array |
+ | These data are stored as array \(\{x_n,g_n\}, \{n,1,M\} ~ ~\), |
| − | where |
+ | where \(M=209 ~\) is total number of experimental data. Approximating functions are specified below: |
| + | \( |
||
| − | $ |
||
\begin{array}{c|l|r|r} |
\begin{array}{c|l|r|r} |
||
\rm Label &~ ~ ~ ~ ~ f(x) & D ~ ~ & Q ~ ~\\ |
\rm Label &~ ~ ~ ~ ~ f(x) & D ~ ~ & Q ~ ~\\ |
||
| Line 45: | Line 45: | ||
\hline |
\hline |
||
\end{array} |
\end{array} |
||
| + | \) |
||
| − | $ |
||
The last two columns of the table above characterise the precision of each approximation: |
The last two columns of the table above characterise the precision of each approximation: |
||
| − | + | \(\displaystyle D= \frac{1}{M} \sum_{n=1}^{M} |f(x_n)-g_n|\) |
|
| − | + | \(\displaystyle Q= \sqrt{\frac{1}{M} \sum_{n=1}^{M} (f(x_n)-g_n)^2}\) |
|
== Comment == |
== Comment == |
||
Latest revision as of 18:47, 30 July 2019
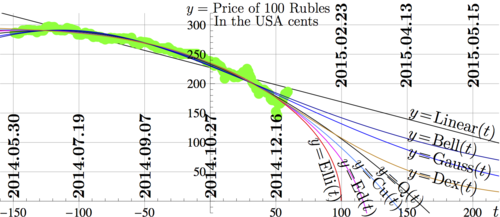
2014.12.26rubleDollar is set of approximations of value of hundred of Russian roubles, measured in the USA cents, for the end of year 2014.
The The green thick curve represents the experimental data \(y=g(x)=\mathrm{Measured}(x)\) by https://www.mataf.net/en/currency/converter-USD-RUB ; coordinate \(x\) has sense of time, measured in days since the date of beginning of the project, 2014,10,27.
For each datum stored for specified year,month,day, the time \(x\) is evaluated as
\(x = \rm daju24(year,month, day)- daju24(2014,10, 27)\)
with function daju24 defined below in C++:
int daju24(int Y,int M, int D){ int a, y, m;
a = (14-M)/12;
y = Y + 4800 - a;
m = M + 12*a - 3;
return D + (153*m+2)/5 + 365*y + y/4 - y/100 + y/400 - 32045 - 2400000; }
These data are stored as array \(\{x_n,g_n\}, \{n,1,M\} ~ ~\), where \(M=209 ~\) is total number of experimental data. Approximating functions are specified below:
\( \begin{array}{c|l|r|r} \rm Label &~ ~ ~ ~ ~ f(x) & D ~ ~ & Q ~ ~\\ \hline \rm Linear &227.323 - 0.583872 x &\! 10.52733 &\! 13.15973\\ %{227.32289289657714` - 0.5838719175561293` x, 10.52725166548383`, 13.15967254961913`} \rm Qu\! & 233.214 - 0.908933 x - 0.00361841 x^2 & 3.94609& 5.84960\\ %3.946087936982961`, 5.849600340588587 \rm Ellipse &~ ~ ~ ~ ~ ~ ~ ~ ~ ~ ~ ~ ~ ~ ~ ~ 1.19332 \sqrt{(99.8879 - x) (388.557 + x)} & 3.72305 & 5.74477\\ \rm Ed & -96.8595 + 1.46555 \sqrt{(127.305 - x) (401.761 + x)} & 3.74359 & 5.71801\\ \rm Cu & 234.636 - 0.905604 x - 0.00456087 x^2 - 6.98113\!\times\!10^{-6}~ x^3 & 3.77297 & 5.72430\\ \rm Bell & 291.207 / \cosh(0.715005 + 0.00630878 x)& 4.91540& 6.96990\\ \rm Gauss & 290.656 \exp\Big(-0.0000168642 (116.58 + x)^2\Big) & 4.45347&6.43202\\ \rm Dex &\!\! 100/\Big(0.337261 \exp(0.000020293 x) + 0.0881639 \exp(0.0189706 x)\Big) \!& 3.79927& 5.72350\\ \hline \end{array} \)
The last two columns of the table above characterise the precision of each approximation:
\(\displaystyle D= \frac{1}{M} \sum_{n=1}^{M} |f(x_n)-g_n|\)
\(\displaystyle Q= \sqrt{\frac{1}{M} \sum_{n=1}^{M} (f(x_n)-g_n)^2}\)
Comment
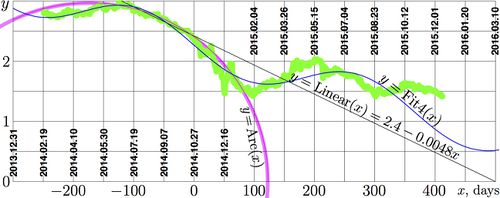
Any scientific concept has limit range of applicability. The approximations and forecasts of the pride of a vault are not exception. The later data show, during two months since the preparation and loading of the approximations, roughly, until 2015.02.04, the "pessimistic" extrapolations still show good agreement with experimental data.. Then, for few years, the price of ruble stabilises between one and two USA cents.
References
2014.12.16.
http://flashnord.com/news/murmanskiy-bank-prodaet-evro-po-150-rubley
СЕРГЕЙ ФАДЕИЧЕВ. ТАССМУРМАНСКИЙ БАНК ПРОДАЕТ ЕВРО ПО 150 РУБЛЕЙ. 16.12.2014 - 15:59.
ОАО «Мурманский социальный коммерческий банк» (МСКБ) во вторник продает евро по 150 рублей, а покупает по 60 рублей, если сумма обменной операции превышает 5 тыс. евро сообщили FlashNord в банке.
При покупке до 5 тыс. евро банк установил следующие курсы: продажа — 120 рублей, покупка — 75 рублей.
2014.12.17. http://ndn.info/novosti/3280-v-novosibirske-evro-vyros-do-120-rublej-a-dollar-do-100 В Новосибирске евро вырос до 120 рублей, а доллар до 100. Дата: 17 Декабрь 2014. Девять банков в Новосибирске продают сегодня евро дороже 100 рублей, фиксирует сайт «ExCur». Лидер — «Внешпромбанк» — продает евро за 120 рублей, а покупает за 72,6 рубля. На втором месте — банк «Уралсиб» с продажей по 115 рублей и покупкой по скрупулезной цене 72,61 рубля. До продажи доллара за 100 рублей дотянулся пока только «Внешпромбанк». На втором месте «Уралсиб» с продажей доллара за 99,80 рублей.
2014.12.17. http://www.kaluga-poisk.ru/novosti-kaluga/ekonomika/kurs-dollara-v-kaluge-2015 Курс доллара в Калуге 2015. 17-12-2014 · 17:11. .. калужские банки не отличились своей жадностью в этот шоковый период. Так, в Мурманске доллары предлагали по 120 рублей, а евро и вовсе по 150 рублей. ..
2015.03.00 http://www.m-hikari.com/ams/ams-2015/ams-17-20-2015/kouznetsovAMS17-20-2015.pdf http://mizugadro.mydns.jp/PAPERS/2015ruble.pdf D.Kouznetsov. Currency band and the approximations: Fitting of rouble with 3-parametric functions. Applied Mathematical Sciences, Vol. 9, 2015, no. 17, 831 - 838

