Difference between revisions of "File:2021.12.05.RuDcomp.png"
| Line 1: | Line 1: | ||
| + | <div style="margin:-2px -14px 0px -200px; background-color:#fff"> |
||
| + | <div style="margin:0px 0px 0px 30px; line-height:1.2em"> |
||
| + | <div style="float:right; margin:0px 0px 0px 0px; background-color:#fff"> |
||
| + | [[File:2021.12.05.rud.png|440px]] |
||
| + | </div> |
||
| + | Comparison of data about death tall from [[Covid]] in Russia versus time \(t\) measured in days since 2020.02.15. The screenshot of the graphic by [[Worldometer]] for 2021.12.04 |
||
| + | <ref name="w"> |
||
| + | https://www.worldometers.info/coronavirus/country/russia/ |
||
| + | WORLD / COUNTRIES / RUSSIA |
||
| + | Last updated: December 04, 2021, 22:41 GMT |
||
| + | Coronavirus Cases: 9,769,011 |
||
| + | Deaths: 280,072 |
||
| + | Recovered: 8,471,813 |
||
| + | </ref> is shown in figure at right; this curve is reproduced in figure above, |
||
| + | it appears with orange strip. |
||
| + | |||
| + | Worldometer does not provide any easy access to the tables of values used to plot the pictures; |
||
| + | so, the screenshot is used for the comparison. |
||
| + | |||
| + | The black curve shows data by [[ourworldindata]] <ref>https://covid.ourworldindata.org/data/owid-covid-data.csv |
||
| + | 2021.12.04 |
||
| + | </ref>. |
||
| + | |||
| + | The values for the death tall in Russia are extracted with command |
||
| + | <br> |
||
| + | grep Russia owid-covid-data.csv |cut -d, -f 3,4,8 > 00.dat |
||
| + | |||
| + | The Bblue curve shows the approximation/exrapolation \(F\) with elementary function |
||
| + | |||
| + | \(F(T) = 0.024\, T^{5/2} \) |
||
| + | |||
| + | where \(T\) is time measured in days since 2020.02.15 .<br> |
||
| + | Up to date, no other (more optimistic) forecast is found in the literature. |
||
| + | |||
| + | The generator of the curve is copy pasted below. |
||
| + | ==Generator== |
||
| + | Image by worldometer should be loaded in order to execute the code below. |
||
| + | |||
| + | <pre> |
||
| + | <!DOCTRINE html><html><body><small><small><small> |
||
| + | <?php |
||
| + | $j0=juliantojd(2, 15, 2020); |
||
| + | for($t=0;$t<1001;$t++) $P[$t]=0; |
||
| + | |||
| + | $myfile = fopen("00.dat", "r") or die("Unable to open file!"); |
||
| + | for($i=0;$i<1001;$i++) |
||
| + | { |
||
| + | $g=fgets($myfile); |
||
| + | $h=explode(",",trim($g)); |
||
| + | $s=count($h); if($s<2) break; |
||
| + | $s=strlen($h[2]); |
||
| + | $f=explode("-",$h[1]); $j=juliantojd($f[1], $f[2], $f[0]); |
||
| + | if($s>1){ $t=$j-$j0; // echo "$h[1] $t $h[2] "; |
||
| + | $u=sscanf($h[2],"%d"); $v=$u[0]; |
||
| + | // echo $v,"<br>\n"; |
||
| + | $P[$t]=$v; |
||
| + | } |
||
| + | } |
||
| + | fclose($myfile); |
||
| + | $T=$t; echo "Total tall for T=$T days<br>"; // for($t=0;$t<$T;$t++) { echo "$t,$P[$t] <br>" ;} |
||
| + | |||
| + | echo "<svg width='852'; height='500';>"; |
||
| + | #echo "<image x='-29' y='106' preserveAspectRatio='none' width='729' height='402' xlink:href='2021.12.05.rud.png'/>"; |
||
| + | echo "<image x='-28' y='98' preserveAspectRatio='none' width='733' height='410' xlink:href='2021.12.05.rud.png'/>"; |
||
| + | $L=36; |
||
| + | $B=408; |
||
| + | $j0=juliantojd(2, 15, 2020); |
||
| + | for($y=0;$y<401;$y+=50) { $x1=$L; $x2=$L+800; $Y=$B-$y; |
||
| + | echo "<line x1=$x1 y1=$Y x2=$x2 y2=$Y stroke='black' stroke-width='.5'/>\n";} |
||
| + | |||
| + | $y=300; $Y=$B+4-$y; echo "<text transform='translate(0,$Y)'>300k </text> \n"; |
||
| + | $y=200; $Y=$B+4-$y; echo "<text transform='translate(0,$Y)'>200k </text> \n"; |
||
| + | $y=100; $Y=$B+4-$y; echo "<text transform='translate(0,$Y)'>100k </text> \n"; |
||
| + | $y=0 ; $Y=$B+4-$y; echo "<text text-anchor='end' transform='translate(30,$Y)'> 0 </text> \n"; |
||
| + | |||
| + | for($t=0;$t<801;$t+=10){$X=$L+$t; $Y1=$B; $Y2=$B-400; |
||
| + | echo "<line x1=$X y1=$Y1 x2=$X y2=$Y2 stroke='black' stroke-width='.5'/>\n"; } |
||
| + | |||
| + | $B4=$B+4; |
||
| + | for($t=0;$t<801;$t+=50) |
||
| + | { |
||
| + | $X=$L+$t; |
||
| + | $X1=$L+$t+1; |
||
| + | $Xp=$X+5; |
||
| + | $j=$j0+$t; |
||
| + | $d0=jdtojulian($j); |
||
| + | $d1=explode("/",$d0); |
||
| + | $text=sprintf("%04d.%02d.%02d",$d1[2],$d1[0],$d1[1]); |
||
| + | $tex=sprintf("%d",$t); |
||
| + | echo "<line x1=$X y1=30 x2=$X y2=$B4 stroke='RGB(255,0,255)' stroke-width='.8' />\n"; |
||
| + | echo "<text text-anchor='middle' transform='translate($Xp,350) rotate(-90)'>$text</text> \n"; |
||
| + | echo "<text text-anchor='middle' transform='translate($X1,420)'>$tex</text> \n"; |
||
| + | } |
||
| + | |||
| + | echo "<polyline points='\n"; |
||
| + | |||
| + | for($t=0;$t<$T;$t++) |
||
| + | { |
||
| + | $X=$L+$t; |
||
| + | $Y=$B - 0.001 * $P[$t]; |
||
| + | echo "$X,$Y "; |
||
| + | } |
||
| + | |||
| + | echo "'"; |
||
| + | echo " style='fill:none;stroke:#000;stroke-width:1.2' /> \n"; |
||
| + | |||
| + | echo "<polyline points='\n"; |
||
| + | for($t=0;$t<811;$t++) |
||
| + | { |
||
| + | $X=$L+$t; |
||
| + | #$Y=$B - 0.001 * .5*$t*$t; |
||
| + | $Y=$B - 0.001 * .024*$t*$t*sqrt($t); |
||
| + | echo "$X,$Y "; |
||
| + | } |
||
| + | echo "'"; |
||
| + | echo " style='fill:none;stroke:#00f;stroke-width:1' /> \n"; |
||
| + | |||
| + | echo "</svg>"; |
||
| + | ?> |
||
| + | </body> |
||
| + | </html> |
||
| + | </pre> |
||
| + | |||
| + | ==Discussion== |
||
| + | Data by Worldometer <ref name="w"> |
||
| + | https://www.worldometers.info/coronavirus/country/russia/ |
||
| + | WORLD / COUNTRIES / RUSSIA |
||
| + | Last updated: December 04, 2021, 22:41 GMT |
||
| + | Coronavirus Cases: 9,769,011 |
||
| + | Deaths: 280,072 |
||
| + | Recovered: 8,471,813 |
||
| + | </ref> |
||
| + | and data by https://covid.ourworldindata.org/data/owid-covid-data.csv |
||
| + | show reasonable agreement: the relative deviation is of order of one percent; |
||
| + | at the graphic, is roughly corresponds to the width of the orange curve by Worldometer. |
||
| + | |||
| + | At the qualitative extrapolation, this deviation can be neglected. |
||
| + | |||
| + | The extrapolation for Russia seems to be worst among similar extrapolation for various countries: |
||
| + | it is al little bit faster than quadratic; the daily death tall grows a little bit faster than linear. |
||
| + | |||
| + | The extrapolation holds since the end of year 2020; one may expect it to hold longer. |
||
| + | |||
| + | ==References== |
||
| + | <references/> |
||
| + | |||
| + | [[Category:Collapse of RF]] |
||
| + | [[Category:Covid]] |
||
| + | [[Category:Designate Russia as state sponsor of terrorism]] |
||
| + | [[Category:Extrapolation]] |
||
| + | [[Category:Kestus]] |
||
| + | [[Category:Russia]] |
||
| + | [[Category:Screenshot]] |
||
| + | [[Category:Worldometer]] |
||
Latest revision as of 09:55, 5 December 2021

Comparison of data about death tall from Covid in Russia versus time \(t\) measured in days since 2020.02.15. The screenshot of the graphic by Worldometer for 2021.12.04 [1] is shown in figure at right; this curve is reproduced in figure above, it appears with orange strip.
Worldometer does not provide any easy access to the tables of values used to plot the pictures; so, the screenshot is used for the comparison.
The black curve shows data by ourworldindata [2].
The values for the death tall in Russia are extracted with command
grep Russia owid-covid-data.csv |cut -d, -f 3,4,8 > 00.dat
The Bblue curve shows the approximation/exrapolation \(F\) with elementary function
\(F(T) = 0.024\, T^{5/2} \)
where \(T\) is time measured in days since 2020.02.15 .
Up to date, no other (more optimistic) forecast is found in the literature.
The generator of the curve is copy pasted below.
Generator
Image by worldometer should be loaded in order to execute the code below.
<!DOCTRINE html><html><body><small><small><small>
<?php
$j0=juliantojd(2, 15, 2020);
for($t=0;$t<1001;$t++) $P[$t]=0;

$myfile = fopen("00.dat", "r") or die("Unable to open file!");
for($i=0;$i<1001;$i++)
{
$g=fgets($myfile);
$h=explode(",",trim($g));
$s=count($h); if($s<2) break;
$s=strlen($h[2]);
$f=explode("-",$h[1]); $j=juliantojd($f[1], $f[2], $f[0]);
if($s>1){       $t=$j-$j0; // echo "$h[1] $t $h[2] ";
                $u=sscanf($h[2],"%d"); $v=$u[0];
                // echo $v,"<br>\n";
                $P[$t]=$v;
        }
}
fclose($myfile);
$T=$t; echo "Total tall for T=$T days<br>";   // for($t=0;$t<$T;$t++) { echo "$t,$P[$t] <br>" ;}

echo "<svg width='852'; height='500';>";
#echo "<image x='-29' y='106' preserveAspectRatio='none' width='729' height='402' xlink:href='2021.12.05.rud.png'/>";
echo "<image x='-28' y='98' preserveAspectRatio='none' width='733' height='410' xlink:href='2021.12.05.rud.png'/>";
$L=36;
$B=408;
$j0=juliantojd(2, 15, 2020);
for($y=0;$y<401;$y+=50) { $x1=$L; $x2=$L+800; $Y=$B-$y;
echo "<line x1=$x1 y1=$Y x2=$x2 y2=$Y stroke='black' stroke-width='.5'/>\n";}

$y=300; $Y=$B+4-$y; echo "<text transform='translate(0,$Y)'>300k </text> \n";
$y=200; $Y=$B+4-$y; echo "<text transform='translate(0,$Y)'>200k </text> \n";
$y=100; $Y=$B+4-$y; echo "<text transform='translate(0,$Y)'>100k </text> \n";
$y=0   ; $Y=$B+4-$y; echo "<text text-anchor='end' transform='translate(30,$Y)'>   0 </text> \n";

for($t=0;$t<801;$t+=10){$X=$L+$t; $Y1=$B; $Y2=$B-400;
 echo "<line x1=$X y1=$Y1 x2=$X y2=$Y2 stroke='black' stroke-width='.5'/>\n"; }

$B4=$B+4;
for($t=0;$t<801;$t+=50)
{
 $X=$L+$t;
 $X1=$L+$t+1;
 $Xp=$X+5;
 $j=$j0+$t;
$d0=jdtojulian($j);
$d1=explode("/",$d0);
$text=sprintf("%04d.%02d.%02d",$d1[2],$d1[0],$d1[1]);
$tex=sprintf("%d",$t);
echo "<line x1=$X y1=30 x2=$X y2=$B4 stroke='RGB(255,0,255)' stroke-width='.8' />\n";
echo "<text text-anchor='middle' transform='translate($Xp,350) rotate(-90)'>$text</text> \n";
echo "<text text-anchor='middle' transform='translate($X1,420)'>$tex</text> \n";
}

echo "<polyline points='\n";

for($t=0;$t<$T;$t++)
{
$X=$L+$t;
$Y=$B - 0.001 * $P[$t];
echo "$X,$Y ";
}

echo "'";
echo " style='fill:none;stroke:#000;stroke-width:1.2' /> \n";

echo "<polyline points='\n";
for($t=0;$t<811;$t++)
{
$X=$L+$t;
#$Y=$B - 0.001 * .5*$t*$t;
$Y=$B - 0.001 * .024*$t*$t*sqrt($t);
echo "$X,$Y ";
}
echo "'";
echo " style='fill:none;stroke:#00f;stroke-width:1' /> \n";

echo "</svg>";
?>
</body>
</html>
Discussion
Data by Worldometer [1] and data by https://covid.ourworldindata.org/data/owid-covid-data.csv show reasonable agreement: the relative deviation is of order of one percent; at the graphic, is roughly corresponds to the width of the orange curve by Worldometer.
At the qualitative extrapolation, this deviation can be neglected.
The extrapolation for Russia seems to be worst among similar extrapolation for various countries: it is al little bit faster than quadratic; the daily death tall grows a little bit faster than linear.
The extrapolation holds since the end of year 2020; one may expect it to hold longer.
References
- ↑ 1.0 1.1 https://www.worldometers.info/coronavirus/country/russia/ WORLD / COUNTRIES / RUSSIA Last updated: December 04, 2021, 22:41 GMT Coronavirus Cases: 9,769,011 Deaths: 280,072 Recovered: 8,471,813
- ↑ https://covid.ourworldindata.org/data/owid-covid-data.csv 2021.12.04
File history
Click on a date/time to view the file as it appeared at that time.
| Date/Time | Thumbnail | Dimensions | User | Comment | |
|---|---|---|---|---|---|
| current | 09:54, 5 December 2021 | 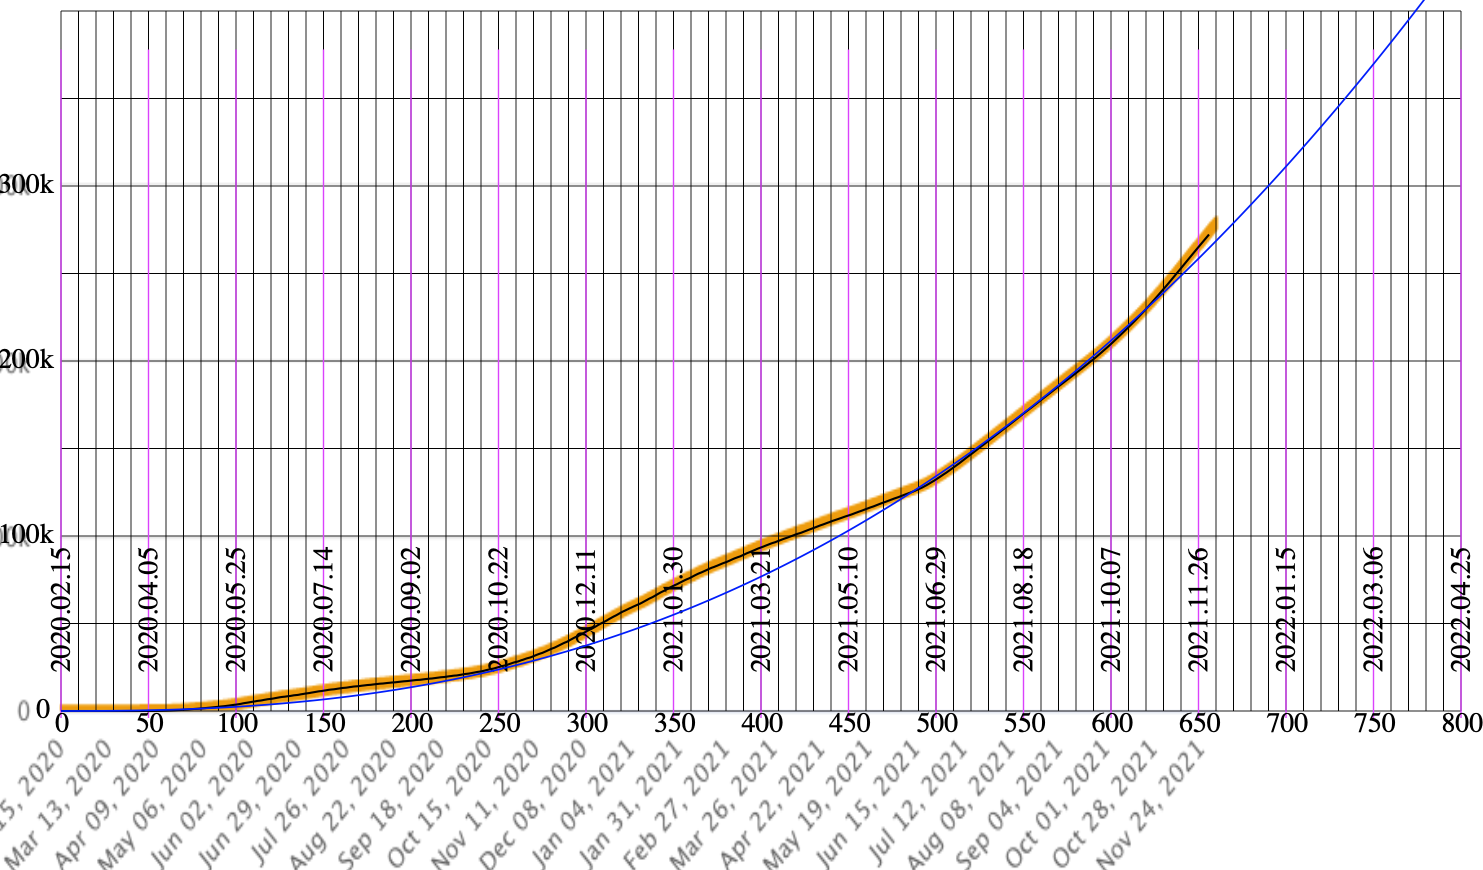 | 1,483 × 870 (231 KB) | T (talk | contribs) |
- You cannot overwrite this file.
File usage
The following page links to this file: