Search results
Create the page "Approximation of functions" on this wiki! See also the search results found.
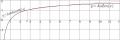
File:AuZexLamPlotT.jpg [[Explicit plot]] of functions [[AuZex]] (thick black curve) and [[LambertW]] (thin red curve). See [[AuZex approximation]] for details.(2,508 × 841 (169 KB)) - 08:30, 1 December 2018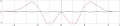
File:FourierExampleGauss16pol04Ta.png [[Explicit plot]] of the [[self-Fourier function]] and its discrete approximation. ...\approx0.626657$ , the $A$ is practically overlapped with the evaluation of its the Fourier transform, $B$, red curve,(2,134 × 470 (88 KB)) - 09:39, 21 June 2013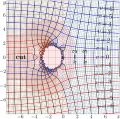
File:TaniaBigMap.png ...map]] of the truncated expansion of the [[Tania function]] at large values of its argument. Function <br> In the shaded range, the precision of the approximation is smaller than 3; the precision is defined with<br>(851 × 841 (654 KB)) - 08:53, 1 December 2018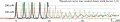
File:TodaShow.png ...tate laser in the transient regime ([[self-pulsation]] to the simple model of [[Oscillator Toda]]. ...laser as oscillator Toda: approximation of the solution through elementary functions -- J. Phys. A: 40, 2107-2124 (2007).(1,707 × 317 (155 KB)) - 09:39, 21 June 2013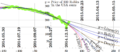
File:2014.12.26rubleDollar.png Price of 100 ruddian rubles, measured in the USA cents; data for the end of year 2014 and the approximations with elementary functions.(1,502 × 651 (246 KB)) - 08:26, 1 December 2018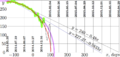
File:2014.12.31rudo.png ...the USA cents, $y$, versus time $x$, measured in days since the beginning of the project (2014.10.27). The thick ping arc covers the approximation(1,452 × 684 (190 KB)) - 08:26, 1 December 2018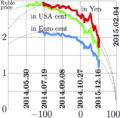
File:2014ruble15t.png Price of Russian rubble, expressed in Japanese yen (red), in the USA cents (green) a Time is measured in days. Time zero corresponds to the date of the beginning of the project, 2014.10.27.(693 × 680 (110 KB)) - 08:26, 1 December 2018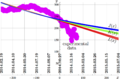
File:2014rubleDollar2param.png Price of 100 Russian roubles evaluated in the USA cents versus time. TIme$x$ is measured in days since the beginning of the project, 2014.10.27.(1,527 × 1,004 (232 KB)) - 08:26, 1 December 2018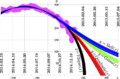
File:2014rubleDollar3param.png Price of 100 Russian roubles, evaluated in the USA cents, versus time. Time $x$ is measured in days since the beginning of the project, 2014.10.27.(1,273 × 837 (294 KB)) - 08:26, 1 December 2018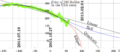
File:2014specula.png Price of 100 roubles measured in the USA cents. The abscissa $t$ has sense of time, measured in days since the beginning of the project,(1,502 × 651 (177 KB)) - 08:26, 1 December 2018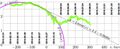
File:2015ruble2.jpg Value $y$ of Russian rubble, measured in the USA cents, versus time $x$. Time $x$ is measured in days simce the beginning of the project, 2014.10.27.(1,726 × 709 (248 KB)) - 08:26, 1 December 2018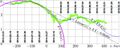
File:2015ruble3.jpg Update of file http://mizugadro.mydns.jp/t/index.php/File:2015ruble2.jpg Value $y$ of Russian rubble, measured in the USA cents, versus time $x$.(1,726 × 684 (266 KB)) - 08:26, 1 December 2018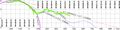
File:2016ruble1.jpg Update of image http://mizugadro.mydns.jp/t/index.php/File:2015ruble3.jpg Value $y$ of Russian rubble, measured in the USA cents, versus time $x$.(2,764 × 684 (414 KB)) - 08:27, 1 December 2018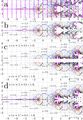
File:Analuxp01t400.jpg Comparison of various fits of the [[natural titration]] with the [[complex map]s Lines of constant [[logamplitude]] $u$ and phase $v$ are shown in the complex plane:(2,083 × 3,011 (1.67 MB)) - 08:29, 1 December 2018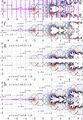
File:Analuxp01u400.jpg [[Complex map]]s of various approximations $f$ of [[natural tetration]]. ==Description of curves==(2,083 × 3,011 (1.72 MB)) - 08:29, 1 December 2018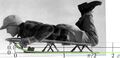
File:Boyt.jpg Approximation of the shape of the sledge runner by http://en.wikipedia.org/wiki/File:Boy_on_snow_sled,_1945.jpg Father of JGKlein. Boy on snow sled, 1945.(5,105 × 2,449 (1.17 MB)) - 08:31, 1 December 2018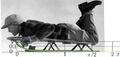
File:Boyt100.jpg Approximation of the shape of the sledge runner by http://en.wikipedia.org/wiki/File:Boy_on_snow_sled,_1945.jpg Father of JGKlein. Boy on snow sled, 1945.(3,473 × 1,646 (467 KB)) - 08:31, 1 December 2018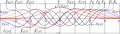
File:Hermigaaplot.jpg Explicit plot of the [[Oscillator function]]s (coloured curves) The approximations are build with functions [[amos]] that(1,672 × 477 (247 KB)) - 08:37, 1 December 2018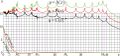
File:Norifit76fragment.jpg Analysis of the approximation of [[nori function]] through function [[korifit76]], where functions nori and kori are evaluated through the straightforward definitions using t(967 × 448 (155 KB)) - 08:44, 1 December 2018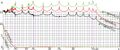
File:Norifit76plot.jpg Analysis of the approximation of [[nori function]] through function [[korifit76]], where functions nori and kori are evaluated through the straightforward definitions using t(1,070 × 448 (168 KB)) - 08:44, 1 December 2018


