Search results
Create the page "Black circle" on this wiki! See also the search results found.

File:Eps32x22ringVector.jpg The black circle is plotted with the [[EPS]] command [[arc(eps)|arc]].(322 × 222 (12 KB)) - 09:39, 21 June 2013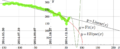
File:2014.12.29rubleDollar.png The straight black line represents the linear approximation of the data, %\put(46,20){\sx{14.9}{\color{pink} \circle{50}}}(1,502 × 610 (142 KB)) - 08:26, 1 December 2018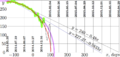
File:2014.12.31rudo.png ==Pink circle== ...scale of the graphic used, this function appears as just part of the round circle.(1,452 × 684 (190 KB)) - 08:26, 1 December 2018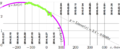
File:2014arc.png the lineal approximation of the data available 2014.10.27 (thin black straight line), and ...that of the abscise axis, approximation Arc appears as arc of the perfect circle. In order to stress this, this arc is a little bit extended below the absci(1,726 × 709 (155 KB)) - 08:26, 1 December 2018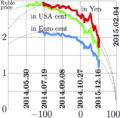
File:2014ruble15t.png The thin black lines correspond to approximations with elementary functions (ellipses cent %\put(46,20){\sx{14.9}{\color{pink} \circle{50}}}(693 × 680 (110 KB)) - 08:26, 1 December 2018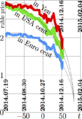
File:2014ruble17t.png The black thin lines correspond to the fitting made 2014.12.16. %\put(46,20){\sx{14.9}{\color{pink} \circle{50}}}(456 × 664 (98 KB)) - 08:26, 1 December 2018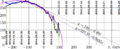
File:2015.01.03rudo.png The black oscillating curve shows the "advanced" fit %\put(-4,20){\sx{14.9}{\color{pink} \circle{50}}}(1,660 × 684 (212 KB)) - 08:26, 1 December 2018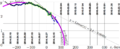
File:2015arc.png The black vertical bars show the data by www.cbr.ru/scripts/XML_dynamic.asp?date_req1 the lineal approximation of the data available 2014.10.27 (thin black straight line), and(1,726 × 709 (190 KB)) - 08:26, 1 December 2018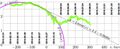
File:2015ruble2.jpg The black line shows the linear approximation, $y=2.4-0.0048x$ \put(46,20){\sx{14.9}{\color{pink} \circle{50}}}(1,726 × 709 (248 KB)) - 08:26, 1 December 2018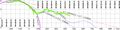
File:2016ruble1.jpg The black line shows the linear approximation, $y=2.4-0.0048x$ \put(46,20){\sx{14.9}{\color{pink} \circle{50}}}(2,764 × 684 (414 KB)) - 08:27, 1 December 2018
File:Circle300.jpg Reproduction of famous painting [[black circle]] by Kazimir Malevic. [[Category:Black circle]](416 × 416 (11 KB)) - 08:32, 1 December 2018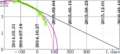
File:Roublellip.png The three approximations (extrapolations) are shown with black straight line, with thick pink arc and with thin red ellipse. The straight black line represents the liner approximation ("500 days"), made 2014.10.27; this(1,519 × 689 (141 KB)) - 08:50, 1 December 2018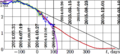
File:Ruble85210a.png The black straight line represents the [[linear approximation]] from 2014.10.27. %\put(46,20){\sx{14.9}{\color{pink} \circle{50}}}(1,519 × 689 (217 KB)) - 08:50, 1 December 2018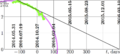
File:RubleArc.png The two approximations (extrapolations) are shown with black straight line and with pink arc. The straight black line represents the liner approximation ("500 days"), made 2014.10.27; this(1,519 × 689 (132 KB)) - 08:50, 1 December 2018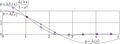
File:Test8trubes300.jpg Small red circle represent the input function, represented at the grid of $M\!=\!8$ points; These circles follow the smooth profile $y\!=\!J_0(x)$, shown with thin black curve(2,133 × 780 (135 KB)) - 08:53, 1 December 2018


