Search results
Create the page "Fit" on this wiki! See also the search results found.
Page title matches

File:Snapwire-vw-fit-walking.JPG ...7Mfg=/768x0/filters:no_upscale():max_bytes(150000):strip_icc()/snapwire-vw-fit-walking-16-feb0671a732844659662ec40cbc0dedd.JPG(768 × 512 (115 KB)) - 05:39, 7 September 2021

Page text matches
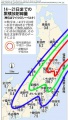
File:4t1.jpg In particular, according to the fit suggested, Sendai (look for canji '''仙台市''' at the map) is not a good ...8.322°N, 142.369°E) is within the main trace of the contamination of the fit extended to the Sea. Is it just an occasion, a coincidence?(789 × 1,391 (86 KB)) - 09:38, 21 June 2013
File:Dissent-is-the-highest-form-of-patriotism.american-apparel-unisex-organic-tee.natural.w380h440z1.jpg ...rs become most valuable to the nation -- keeping us from going astray in a fit of false consensus. 2006 - 2012 Skreened(380 × 440 (45 KB)) - 09:44, 21 June 2013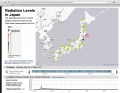
File:Nosendaintera00.jpg Such estimates agree with the fit of the data by Mainichi (which suggests roughly 1000mSv/year), confirming t(1,334 × 1,029 (86 KB)) - 09:38, 21 June 2013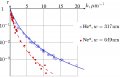
File:QuantumReflection.png Fit <math>~ r=1/(1+kw)^4~</math>(570 × 370 (18 KB)) - 09:39, 21 June 2013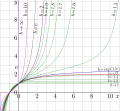
File:Tetreal10bx10d.png The fit is used, that provides several decimal digits, that seems to be sufficient(2,192 × 2,026 (436 KB)) - 13:56, 5 August 2020
File:Dissent-is-the-highest-form-of-patriotism.jpg ...rs become most valuable to the nation -- keeping us from going astray in a fit of false consensus. Skreened, 2006 - 2012.(380 × 440 (45 KB)) - 20:33, 20 June 2013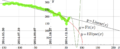
File:2014.12.29rubleDollar.png $y=\mathrm{Fit}(x)=\mathrm{Ellipse}(x)+0.959481\, \exp(0.0601124 x)\, \sin\!\big( 0.179949 For the Fit, the mean deviation $D=3.16$(1,502 × 610 (142 KB)) - 08:26, 1 December 2018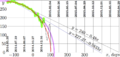
File:2014.12.31rudo.png $y=240-0.48x ~$ , made 2014.10.27. With this fit, the project begun. The first loaded image with this fit is(1,452 × 684 (190 KB)) - 08:26, 1 December 2018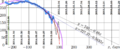
File:2015.01.01rudo.png The red ellipse represents the fit The black oscillating curve represents the improved fit(1,660 × 684 (215 KB)) - 08:26, 1 December 2018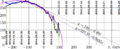
File:2015.01.03rudo.png The second linear fit $y=227.37−0.5833x$ made 2014.12.30 is shown also in figure The black oscillating curve shows the "advanced" fit(1,660 × 684 (212 KB)) - 08:26, 1 December 2018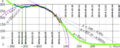
File:2015.01.05rudo.png The second linear fit $y=227.37−0.5833x$ had been suggested 2014.12.30; it is shown also in fig //DB fit(DB x){ return 1.1882*sqrt((100.669 - x)*(389.828 + x));}(1,867 × 747 (271 KB)) - 08:26, 1 December 2018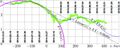
File:2015ruble3.jpg 2015.08.23, at $x=300$, the new data are used to make the new fit with 4 parameters:(1,726 × 684 (266 KB)) - 08:26, 1 December 2018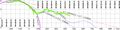
File:2016ruble1.jpg 2015.08.23, at $x=300$, the new data are used to make the new fit with 4 parameters:(2,764 × 684 (414 KB)) - 08:27, 1 December 2018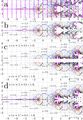
File:Analuxp01t400.jpg ...asymptotic behaviour of the function (last picture, d) from its primitive fit (picture b). $ f(z)=\mathrm{Fit}_{3}(z) = \left\{\!\!(2,083 × 3,011 (1.67 MB)) - 08:29, 1 December 2018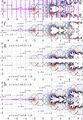
File:Analuxp01u400.jpg $\mathrm {Fit}_{3}(z) = \left\{\!\! \ln\!\big({\rm Fit}_{3}(z\!+\!1)\big)~&~{~\rm at~}~&~ \!&\! \!&\! \Re(z) \!&\! \le \!&\! -(2,083 × 3,011 (1.72 MB)) - 08:29, 1 December 2018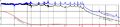
File:Korifit76plot.jpg ...cates, that of order of 10 significant figures can be achieved with such a fit. However, the deviation of the fit from the approximated function is not seen in this curve.(3,831 × 863 (318 KB)) - 08:40, 1 December 2018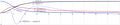
File:Magaplot300.jpg The dotted curve shows its fit, The thin blue line shows deviation of this fit from the [[maga function]]; in order to mage this deviation visible, it is(4,234 × 896 (401 KB)) - 08:42, 1 December 2018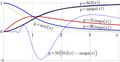
File:MagaplotFragment.jpg The dotted curve shows its fit, The thin blue line shows deviation of this fit from the [[maga function]]; in order to mage this deviation visible, it is(1,743 × 896 (245 KB)) - 08:42, 1 December 2018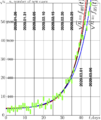
File:2020.03.03fit13t.png Approximation \( f_{35}\) is optimistic. It is constructed to fit the first 35 experimental data, among them, the last dot drops a little bit Approximation \( f_{40}\) is pessimistic. It is constructed to fit the first 40 experimental data, among them, the last 4 dots jump a little b(747 × 891 (100 KB)) - 10:32, 7 March 2020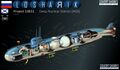
File:Ru Losharik Cutaway940.jpg g out but they are always grainy and have not yet revealed the special fit which is of course below the waterline. All the same some photo analysis, d(940 × 548 (111 KB)) - 10:09, 13 June 2020


