Search results
Create the page "Green" on this wiki! See also the search results found.
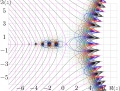
File:Factorialz.jpg some of intermediate levels <math>v=</math>const are shown with thin green lines.<br>(1,219 × 927 (479 KB)) - 08:35, 1 December 2018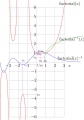
File:FactoReal.jpg <math>\mathrm{factorial}^{-1}(x)</math>, green;(915 × 1,310 (141 KB)) - 08:35, 1 December 2018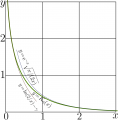
File:Besselk0plotT400.png $y\!=\! \mathrm{BesselK0}(x)$ is shown with thick green line.(1,783 × 1,816 (189 KB)) - 09:41, 21 June 2013
File:BesselY0J0J1plotT060.png [[Explicit plot]] of [[BesselY0]] (red), [[BesselJ1]] (green) and [[BesselJ0]] (blue).(1,362 × 217 (47 KB)) - 09:42, 21 June 2013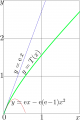
File:DoyaplotTc.png is shown with thick green line.(881 × 1,325 (95 KB)) - 09:43, 21 June 2013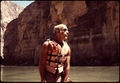
File:FredEiseman.jpg ...Eiseman Collection documents trips along the Colorado, Little Colorado and Green Rivers during the period of the 1950s and 1960s.(640 × 442 (58 KB)) - 09:45, 21 June 2013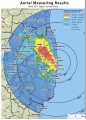
File:Fukushima 180511.jpg is marked with green; Roughly, at the edge of the green and yellow, from each square meter, of order of million beta–particles ar(650 × 904 (255 KB)) - 09:38, 21 June 2013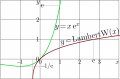
File:LambertWplotT.png $y=\mathrm{zex}(x)=x\, \exp(x)$, light green curve(1,267 × 839 (81 KB)) - 09:43, 21 June 2013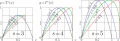
File:Logi1a345T300.png $c=0.5$ (green),(1,636 × 565 (184 KB)) - 08:41, 1 December 2018
File:Logi5T1500.png $s\!=\!3.4$, green solid(3,404 × 540 (185 KB)) - 06:28, 10 June 2022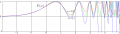
File:Logi5U1500.png $s\!=\!4$, green solid(3,404 × 955 (403 KB)) - 06:30, 10 June 2022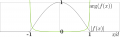
File:Modeab02T.png The thick green curve shows $\arg(f)$(1,678 × 519 (66 KB)) - 09:41, 21 June 2013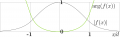
File:Modeab25T.png The thick green curve shows $\arg(f)$(1,678 × 519 (76 KB)) - 09:41, 21 June 2013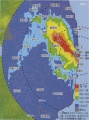
File:Newton2011 7 27b.jpg : $1.9\mu$Sv/h, between light blue and green. : $3.8\mu$Sv/h, between green and yellow(1,025 × 1,377 (81 KB)) - 09:38, 21 June 2013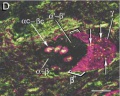
File:PopyphaenisSericataGlutamateTaurine.jpg [[antiglutamate]] (green) and [[antitaurine]] (magenta). Colocalization is indicated by white. Gluta(438 × 349 (17 KB)) - 09:39, 21 June 2013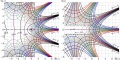
File:QFactorialQexp.jpg The intermediate levels $q=\mathrm{const}$ are shown with thin green lines.(800 × 399 (121 KB)) - 17:23, 11 July 2013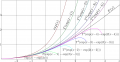
File:SimudoyaTb.png Green, cyan, blue and magenta represent the First, Second, Third and Fourth itera(3,388 × 1,744 (537 KB)) - 08:51, 1 December 2018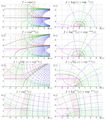
File:SqrtExpZ.jpg are shown with thick green lines. The intersection of these lines indicate the fixed point $L$, which(842 × 953 (83 KB)) - 11:56, 21 June 2013
File:Varipend3v16.png Coordinates $X_n$ are plotted versus time with thick light lines; red, green, blue, pink.(8,334 × 1,384 (592 KB)) - 09:43, 21 June 2013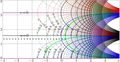
File:Exp1mapT200.jpg The additional thick green lines show $u=\Re(L)$ and $v=\Im(L)$ where $L\approx 0.3+1.3 \mathrm i $ is(2,281 × 1,179 (1.14 MB)) - 12:37, 28 July 2013


