Search results
Create the page "Map of contamination" on this wiki! See also the search results found.
File:C2011mar16a.jpg Map of contamination due to the [[Fucushima disaster]] for March 16, 2011 by data from [[Category:Map]](2,375 × 2,917 (207 KB)) - 10:19, 21 June 2013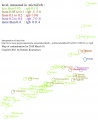
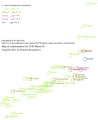
File:C2011mar16c.jpg Map of contamination of Japan due to the [[Fukushima disaster]] for 2011 March 16, plotted by the d This is improved version of the file C2011mar16b.jpg (better resolution)<br>(2,375 × 2,917 (405 KB)) - 17:50, 20 June 2013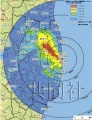
File:47ae1 F59A51E334FB791F36AB413B5BC15C0C.jpg leading to the map of nuclear contamination of Japan in 2011 from ...pan-drawn-with-the-united-states-announced-nuclear-radiation-contamination-map-figure/(230 × 300 (25 KB)) - 09:38, 21 June 2013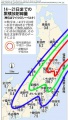
File:4t1.jpg Map of contamination that is usually attributed to the [[Fukushima disaster]], average for 2011 Contour of land/sea/cities and the primary data are by Devchonka from http://mainichi(789 × 1,391 (86 KB)) - 09:38, 21 June 2013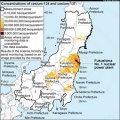
File:AJ2011111217322M.jpg Map of contamination after the [[Fukushima disaster]] reported by [[Asahi Shinbun]] for In any case of use, the source should be attributed.(375 × 375 (156 KB)) - 16:14, 28 December 2018
File:C2011mar17.jpg Map of contamination due to the [[Fukushima disaster]] for 2011 Mar 17 The generator of this image [[c2011mar17.cc]] requires the input files(2,375 × 2,917 (415 KB)) - 09:38, 21 June 2013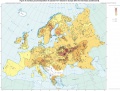
File:ChernobylEurope03.jpg Map of contamination with Cs in Europe by the UN report of year 2000, [[Category:Map]](1,263 × 960 (108 KB)) - 10:21, 21 June 2013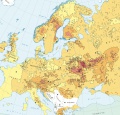
File:ChernobylEuropeCut2a.jpg Cut from the map of contamination of Europe with Cs-137 for y.2008 from the Source of the map. (2008)(1,074 × 1,030 (483 KB)) - 09:38, 21 June 2013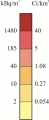
File:ChernobylEuropeNota0a1.jpg Notations for the map of contamination of Europe with Cs-137 for year 2008 by These notations should follow the map ChernobylEuropeCut.jpg(294 × 717 (30 KB)) - 09:38, 21 June 2013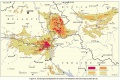
File:ContaminationMap Cs BeUkRu Fig VI.jpg Map of contamination of the Chernobyl region and vicinities by [[Category:Map]](800 × 536 (108 KB)) - 10:23, 21 June 2013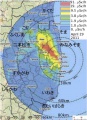
File:Fukushima-ground-ra7.jpg Map of contamination after the [[Fukushima disaster]]. This pic is update of [[File:Fukushima-ground-radiation.jpg|80px]] which seems to be almost unusa(594 × 822 (43 KB)) - 09:38, 21 June 2013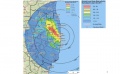
File:Fukushima-ground-radiation.jpg http://maptd.com/new-fukushima-contamination-map/ New Fukushima contamination map. Posted on May 10, 2011 by James(640 × 396 (45 KB)) - 09:38, 21 June 2013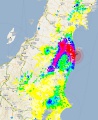
File:Fukushima2011july18a.jpg Map of contamination attributed to the [[Fukushima disaster]], image from If the authorities cannot draw the unambiguous map of contamination, there is no reason to expect that they can handle a nuclear power plant in(735 × 900 (232 KB)) - 09:39, 21 June 2013
File:Fukushima2011july18b.jpg ...00px]] of contamination attributed to the [[Fukushima disaster]], snapshot of the state for 2011 July 18 from(1,745 × 54 (50 KB)) - 09:39, 21 June 2013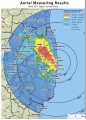
File:Fukushima 180511.jpg ...of radiocaesium (sum of Cs-134 and Cs-137) for the land area within 80 km of the Fukushima Daiichi plant, as reported by the Japanese authorities (MEXT) The scale levels of contamination becomes readable the strong zooming-in of the upper right corner. The following notations are used:(650 × 904 (255 KB)) - 09:38, 21 June 2013
File:FukushimaReport2011may2fig2.jpg Members of the Great East Japan Earthquake Taskforce: Report to the Foreign Academies from Science Council of Japan on the Fukushima Daiichi Nuclear Power Plant Accident.(864 × 1,038 (53 KB)) - 09:38, 21 June 2013
File:Image-202028-galleryV9-ehmb.jpg Map of radioactive contamination for 2011 April 7 by Der Spiegel, Numbers indicate the levels of radiation in microsievert/hour(343 × 600 (88 KB)) - 09:38, 21 June 2013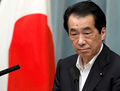
File:Naoto332x252.jpg photo of [[Kan Naoto]] by ...pril of 2011, its rank raised since 4 to 7. The publication of the map of contamination after that catastrophe lated for several months.(332 × 252 (66 KB)) - 15:26, 28 December 2018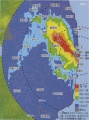
File:Newton2011 7 27b.jpg Map of contamination after the [[Fukushima disaster]]. Colors represent the density $D(\alpha,\delta)$ of ionizing radiation measured from the aircrafts (airplanes helicopters) and(1,025 × 1,377 (81 KB)) - 09:38, 21 June 2013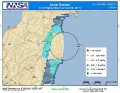
File:NISAdoe1.jpg Map of contamination after the [[Fukushima disaster]] Some other data indicate the level of radiation in $\mu$Sv/hour(769 × 595 (108 KB)) - 09:38, 21 June 2013


