Search results
Create the page "Maps" on this wiki! See also the search results found.
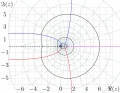
File:ArcGamma.jpg [[Category:Complex maps]](1,188 × 924 (156 KB)) - 08:29, 1 December 2018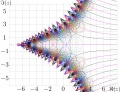
File:OneOverFactorial.jpg [[Category:Complex maps]](1,244 × 949 (276 KB)) - 17:50, 20 June 2013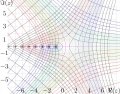
File:LogFactorialZ.jpg [[Category:Complex maps]](1,237 × 965 (717 KB)) - 17:50, 20 June 2013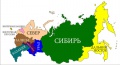
File:0043gpy4.jpeg [[Category:Maps]](640 × 344 (39 KB)) - 09:39, 21 June 2013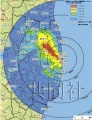
File:47ae1 F59A51E334FB791F36AB413B5BC15C0C.jpg ...how the map; the only icon is available. Qualitatively, it agrees with the maps shown in the article [[Fukushima disaster]]: the Trend to the North-West an [[Category:Maps]](230 × 300 (25 KB)) - 09:38, 21 June 2013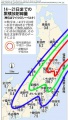
File:4t1.jpg http://maps.google.com/maps/ms?ie=UTF8&hl=en&t=h&source=embed&oe=UTF8&msa=0&msid=216097317933419817421. ==Similar maps==(789 × 1,391 (86 KB)) - 09:38, 21 June 2013
File:765-766---17.jpg Similar maps appear also at other sites [[Category:Maps]](300 × 199 (51 KB)) - 09:39, 21 June 2013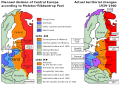
File:800px-Ribbentrop-Molotov.svg.png [[Category:Maps]](800 × 566 (170 KB)) - 09:39, 21 June 2013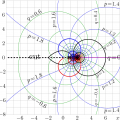
File:AbelFactorialMap.png [[Category:Complex maps]](675 × 673 (120 KB)) - 08:28, 1 December 2018
File:AcipmapTjpg.jpg The separation from other funcitons allows to plot several maps in the same style. However, for different pictures, the different styles ma(1,759 × 1,746 (661 KB)) - 09:41, 21 June 2013
File:AcipmapTpng.png The separation from other funcitons allows to plot several maps in the same style. However, for different pictures, the different styles ma(844 × 838 (199 KB)) - 09:41, 21 June 2013
File:AcoscmapT300.png ...part; and also values of these levels. Usually it worth to prepare all the maps in a manuscript in the same style, id est, with the same [[plofu.cin]]. How(3,517 × 3,492 (1.64 MB)) - 09:41, 21 June 2013
File:ArcCipMapT.jpg The separation from other funcitons allows to plot several maps in the same style. However, for different pictures, the different styles ma(1,759 × 1,746 (661 KB)) - 09:41, 21 June 2013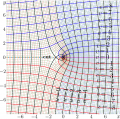
File:ArcTaniaMap.png [[Category:Coplex maps]](851 × 841 (626 KB)) - 08:30, 1 December 2018
File:B271a.png [[Category:Complex maps]](1,609 × 1,417 (506 KB)) - 08:30, 1 December 2018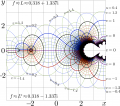
File:B271t.png [[Category:Complex maps]](1,609 × 1,417 (791 KB)) - 08:30, 1 December 2018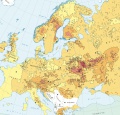
File:ChernobylEuropeCut2a.jpg [[Category:Maps]] [[Category:Maps of contamination]](1,074 × 1,030 (483 KB)) - 09:38, 21 June 2013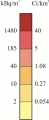
File:ChernobylEuropeNota0a1.jpg [[Category:maps]](294 × 717 (30 KB)) - 09:38, 21 June 2013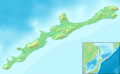
File:Demis-Iturup.png [[Category:Maps]](1,333 × 822 (235 KB)) - 09:40, 21 June 2013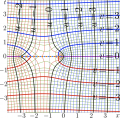
File:Doya10map4bT60.png [[Category:Complex maps]](714 × 700 (342 KB)) - 08:34, 1 December 2018


