Search results
Create the page "Qua" on this wiki! See also the search results found.
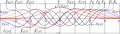
File:Hermigaaplot.jpg and function [[qua]], that approximates the phase of oscillation in the quadratic potential. As for qua, it can be determined in such a way, that $\mathrm{qua}'(z)=\sqrt{1\!-\!z^2}$, id est,(1,672 × 477 (247 KB)) - 08:37, 1 December 2018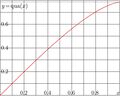
File:Quaplot.jpg $y=\,$[[qua]]$(x)=\frac{1}{2}\big( x\sqrt{1\!-\!x^2}+\arcsin(x)\big)$ The additional horizontal grid line corresponds to $y=\,$[[qua]]$(1)=\pi/4\approx 0.785398$(2,096 × 1,681 (291 KB)) - 08:48, 1 December 2018
