Search results
Create the page "Quadratic function" on this wiki! See also the search results found.
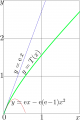
File:DoyaplotTc.png [[Doya function]] with parameter unity of real argument, $y=T(x)=\mathrm{Doya}_1(x)$ The quadratic approximation in vicinity of zero $y=T'(0) x +\frac{1}{2}T''(0)x^2 =\mathrm(881 × 1,325 (95 KB)) - 09:43, 21 June 2013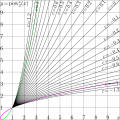
File:IterPowPlotT.png ...licit plot]] of $c$th Iteration of the quadratic function, id est, [[power function]] for power 2; $y=\mathrm{Pow}_2^{~c}(z)=T^c(x)~$ for various values of num is [[superfunction]] for the transfer function $T$ and(2,093 × 2,093 (680 KB)) - 20:50, 28 September 2013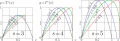
File:Logi1a345T300.png where [[logisticOperator]] is quadratic functin of special kind, ...e branch should be specified, as the logistic operator is not a monotonous function.(1,636 × 565 (184 KB)) - 08:41, 1 December 2018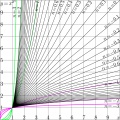
File:PowIteT.jpg ...licit plot]] of $n$th Iteration of the quadratic function, id est, [[power function]] for power 2; $y=\mathrm{Pow}_2^{~c}(z)=T^c(x)~$ for various values of num is [[superfunction]] for the transfer function $T$ and(2,093 × 2,093 (1.01 MB)) - 08:46, 1 December 2018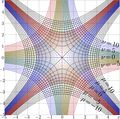
File:Z2itmapT.jpg [[Complex map]] of function $T(z)=z^2$. [[Category:Elementary function]](2,175 × 2,158 (1.74 MB)) - 08:57, 1 December 2018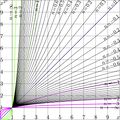
File:IterPowPlotT.jpg [[Iterate]]s of quadratic function, $T(z)=z^2$:(2,092 × 2,092 (1.06 MB)) - 08:38, 1 December 2018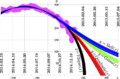
File:2014rubleDollar3param.png Each set is formed with specific four-parametric function $f$, and values of parameters are chosen to minimise the mean square deviat $f(x)=\mathrm{Quadratic}(x)=a + b x +c x^2$(1,273 × 837 (294 KB)) - 08:26, 1 December 2018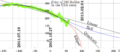
File:2014specula.png ==Quadratic approximation== The black curve shows the quadratic function(1,502 × 651 (177 KB)) - 08:26, 1 December 2018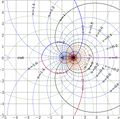
File:Aupower2map.jpg ...ap]] of the [[Abelfunction]] $G$ of the power transfer function (quadratic function) $T(z)\!=\!z^2$ is shown with Abelfunction $G$ is inverse of the [[superpower]] function(2,175 × 2,158 (900 KB)) - 08:30, 1 December 2018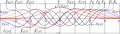
File:Hermigaaplot.jpg Explicit plot of the [[Oscillator function]]s (coloured curves) determines the amplitude of oscillations of the oscillator function in vicinity of zero,(1,672 × 477 (247 KB)) - 08:37, 1 December 2018
File:Magaplot300.jpg [[Explicit plot]] of function [[maga]] and related functions. where $J_0=\,$[[BesselJ0]], the zeroth [[Bessel function]], and $L$ is its first zero, $L=\,$[[BesselJZero]]$[0,1]$.(4,234 × 896 (401 KB)) - 08:42, 1 December 2018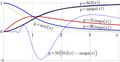
File:MagaplotFragment.jpg [[Explicit plot]] of function [[maga]] and related functions. where $J_0=\,$[[BesselJ0]], the zeroth [[Bessel function]], and $L$ is its first zero, $L=\,$[[BesselJZero]]$[0,1]$.(1,743 × 896 (245 KB)) - 08:42, 1 December 2018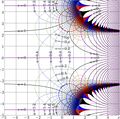
File:SdPow2map.jpg [[Complex map]] of function [[SdPow]]$_2$ ; [[Superpower]] function $F$ is [[superfunction]] for the quadratic transfer function $T(z)\!=\!z^2$,(2,175 × 2,158 (1.47 MB)) - 08:51, 1 December 2018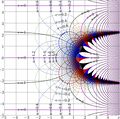
File:Superpower2map.jpg [[Complex map]] of the superpower function Superpower function $F$ is [[superfunction]] for the quadratic transfer function $T(z)\!=\!z^2$,(2,175 × 2,158 (1.39 MB)) - 08:53, 1 December 2018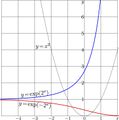
File:Superpower2plot.jpg Explicit plot of two [[superfunction]]s of the quadratic function, $T(z)\!=\!z^2$: $y\!=\!F(x)\!=\! \exp(2^x)~$, blue curve, shows the [[SuPow]] function(1,495 × 1,512 (196 KB)) - 08:53, 1 December 2018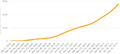
File:2021.12.05.rud.png The growth seem to be a little bit faster than quadratic. Number of patients dead of [[Covid]] in [[Russia]] can be approximated with function(787 × 351 (34 KB)) - 10:00, 5 December 2021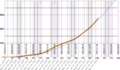
File:2021.12.05.RuDcomp.png The Bblue curve shows the approximation/exrapolation \(F\) with elementary function it is al little bit faster than quadratic; the daily death tall grows a little bit faster than linear.(1,483 × 870 (231 KB)) - 09:55, 5 December 2021
File:GurievAlekseiGermanovich254x309.jpg function \(f\) can be expressed through the [[Student Distribution]] with \(N\!-\!1\ ...blue curve; the Russian military loss \(L\) is extrapolated with quadratic function:<br>(234 × 309 (75 KB)) - 23:02, 31 May 2024


