Search results
Create the page "Quadratic function" on this wiki! See also the search results found.
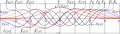
File:Hermigaaplot.jpg Explicit plot of the [[Oscillator function]]s (coloured curves) determines the amplitude of oscillations of the oscillator function in vicinity of zero,(1,672 × 477 (247 KB)) - 08:37, 1 December 2018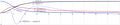
File:Magaplot300.jpg [[Explicit plot]] of function [[maga]] and related functions. where $J_0=\,$[[BesselJ0]], the zeroth [[Bessel function]], and $L$ is its first zero, $L=\,$[[BesselJZero]]$[0,1]$.(4,234 × 896 (401 KB)) - 08:42, 1 December 2018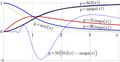
File:MagaplotFragment.jpg [[Explicit plot]] of function [[maga]] and related functions. where $J_0=\,$[[BesselJ0]], the zeroth [[Bessel function]], and $L$ is its first zero, $L=\,$[[BesselJZero]]$[0,1]$.(1,743 × 896 (245 KB)) - 08:42, 1 December 2018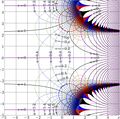
File:SdPow2map.jpg [[Complex map]] of function [[SdPow]]$_2$ ; [[Superpower]] function $F$ is [[superfunction]] for the quadratic transfer function $T(z)\!=\!z^2$,(2,175 × 2,158 (1.47 MB)) - 08:51, 1 December 2018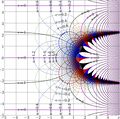
File:Superpower2map.jpg [[Complex map]] of the superpower function Superpower function $F$ is [[superfunction]] for the quadratic transfer function $T(z)\!=\!z^2$,(2,175 × 2,158 (1.39 MB)) - 08:53, 1 December 2018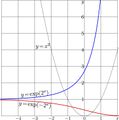
File:Superpower2plot.jpg Explicit plot of two [[superfunction]]s of the quadratic function, $T(z)\!=\!z^2$: $y\!=\!F(x)\!=\! \exp(2^x)~$, blue curve, shows the [[SuPow]] function(1,495 × 1,512 (196 KB)) - 08:53, 1 December 2018- ...] appears at the solution of the [[Stationary Schroedinger equation]] with quadratic potential. == [[Oscillator function]]s ==4 KB (628 words) - 18:47, 30 July 2019
- [[Legendre function]] is solution \(F\) of equation For \(\ell\!=\!1\), the solution is linear function.3 KB (442 words) - 18:44, 30 July 2019
- Function [[maga]] appears at the consideration of the principal mode guided by the s The scalar product of function [[mori]] to itself with quadratic defacement is denoted with identifier [[naga]]8 KB (1,256 words) - 18:44, 30 July 2019
- [[File:Superpower2plot.jpg|360px|thumb|Fig.1. Quadratic function (black curve) and two its [[superfunction]]s]] ...ific [[superpower]] function, id est, the [[superfunction]] of the [[power function]] \(~z\mapsto z^a\!=\!\exp(\ln(z) \,a)~\)1 KB (202 words) - 18:48, 30 July 2019
- [[File:Superpower2plot.jpg|360px|thumb|Fig.1. Quadratic function (black curve) and two its superfunctions]] ...ific [[superpower]] function, id est, the [[superfunction]] of the [[power function]] \(~z\mapsto z^a\!=\!\exp(\ln(z) \,a)~\)3 KB (405 words) - 18:43, 30 July 2019
- ...of the statistical significance of a “second” peak at the correlation function, using the Poissonian model of random (independent) distribution, that can ...ture for years 1989-2020, fit them with linear function and with quadratic function, and check, if the raise of mean temperature accelerates during 30 years si101 KB (14,846 words) - 00:35, 21 March 2023
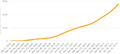
File:2021.12.05.rud.png The growth seem to be a little bit faster than quadratic. Number of patients dead of [[Covid]] in [[Russia]] can be approximated with function(787 × 351 (34 KB)) - 10:00, 5 December 2021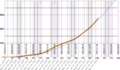
File:2021.12.05.RuDcomp.png The Bblue curve shows the approximation/exrapolation \(F\) with elementary function it is al little bit faster than quadratic; the daily death tall grows a little bit faster than linear.(1,483 × 870 (231 KB)) - 09:55, 5 December 2021- ...»), that approximates the Russian military loss in Ukraine with quadratic function of time. The width of peaks at the [[Churov comb]] and the width of the [[P16 KB (2,233 words) - 15:23, 17 November 2023
- function \(f\) can be expressed through the [[Student Distribution]] with \(N\!-\!1\ ...blue curve; the Russian military loss \(L\) is extrapolated with quadratic function:<br>29 KB (3,240 words) - 14:34, 30 May 2024

File:GurievAlekseiGermanovich254x309.jpg function \(f\) can be expressed through the [[Student Distribution]] with \(N\!-\!1\ ...blue curve; the Russian military loss \(L\) is extrapolated with quadratic function:<br>(234 × 309 (75 KB)) - 23:02, 31 May 2024- ...ation, the Russian military loss in Ukraine is extrapolated with quadratic function: This function is shown with blue curve in the figure at right.43 KB (3,741 words) - 22:20, 11 June 2024


