Search results
Create the page "Black" on this wiki! See also the search results found.
File:Pobeg.jpg [[Category:Black hole]](451 × 500 (61 KB)) - 09:38, 21 June 2013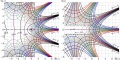
File:QFactorialQexp.jpg Levels <math>p=-4,-3,-2,-1,0,1,2,3,4</math> are shown with thick black lines. ...cuts of the range of [[holomorphic function|holomorphism]] are shown with black dashed lines.(800 × 399 (121 KB)) - 17:23, 11 July 2013
File:RPC.jpg [[Category:Black humor]](1,877 × 2,000 (771 KB)) - 09:42, 21 June 2013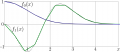
File:SelfCosFTt200.png Their [[DCTI]] transforms are shown with thin black lines.(1,467 × 637 (100 KB)) - 09:42, 21 June 2013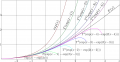
File:SimudoyaTb.png This superfunction is plotted with black curve.(3,388 × 1,744 (537 KB)) - 08:51, 1 December 2018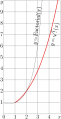
File:SquareRootOfFactorial.png $y\!=\! \mathrm{factorial}(x)=x!$, thin black line, and<br>(538 × 1,050 (34 KB)) - 09:39, 21 June 2013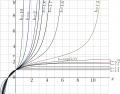
File:Tet10bxr.jpg \definecolor{black}{rgb}{0,0,0}(2,491 × 1,952 (236 KB)) - 08:53, 1 December 2018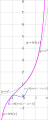
File:TetPlotU.png For comparison, the thin black line shows the [[exponential]], $y=\exp(x)$(838 × 2,088 (124 KB)) - 08:53, 1 December 2018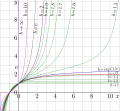
File:Tetreal10bx10d.png \definecolor{black}{rgb}{0,0,0}% <br>(2,192 × 2,026 (436 KB)) - 13:56, 5 August 2020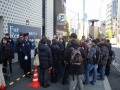
File:TokyoMeeting.jpg The police pushed the protesters into a region marked with red cones and black-yellow tubes.(2,592 × 1,944 (529 KB)) - 09:40, 21 June 2013
File:VaripendChain.gif The 3 material bodies are markes with black dots.(800 × 81 (15 KB)) - 09:43, 21 June 2013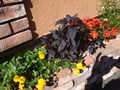
File:02341blackPlant.jpg Black plant, 2014(2,048 × 1,536 (1.34 MB)) - 08:23, 1 December 2018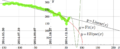
File:2014.12.29rubleDollar.png The straight black line represents the linear approximation of the data,(1,502 × 610 (142 KB)) - 08:26, 1 December 2018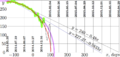
File:2014.12.31rudo.png ==Black oscillating curve== The black oscillating curve represents the improved approximation:(1,452 × 684 (190 KB)) - 08:26, 1 December 2018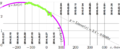
File:2014arc.png the lineal approximation of the data available 2014.10.27 (thin black straight line), and(1,726 × 709 (155 KB)) - 08:26, 1 December 2018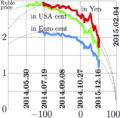
File:2014ruble15t.png The thin black lines correspond to approximations with elementary functions (ellipses cent(693 × 680 (110 KB)) - 08:26, 1 December 2018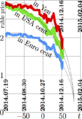
File:2014ruble17t.png The black thin lines correspond to the fitting made 2014.12.16.(456 × 664 (98 KB)) - 08:26, 1 December 2018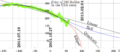
File:2014specula.png The black straight line shows the linear approximation, The black curve shows the quadratic function(1,502 × 651 (177 KB)) - 08:26, 1 December 2018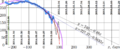
File:2015.01.01rudo.png The black oscillating curve represents the improved fit(1,660 × 684 (215 KB)) - 08:26, 1 December 2018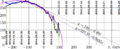
File:2015.01.03rudo.png The black oscillating curve shows the "advanced" fit(1,660 × 684 (212 KB)) - 08:26, 1 December 2018


