Search results
Create the page "Red" on this wiki! See also the search results found.

File:2013forYourFreedomAndOur.jpg [[For your freedom and our]], protest 2013.08.25 near the Red Square at Moscow(800 × 533 (371 KB)) - 19:51, 25 August 2013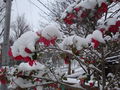
File:02160hanaYuki.JPG Red flowers under snow, 2014.(3,648 × 2,736 (3.41 MB)) - 08:23, 1 December 2018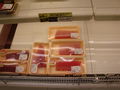
File:02510sakana.jpg Red fish 100g for 257 yen(2,048 × 1,536 (1.3 MB)) - 08:23, 1 December 2018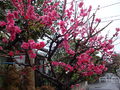
File:02532akame.jpg Red plum flowers. 2015.03.08.(3,648 × 2,736 (3.51 MB)) - 08:23, 1 December 2018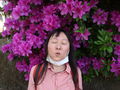
File:02671shoko.jpg Devchonka and red flowers(2,048 × 1,536 (1.29 MB)) - 08:24, 1 December 2018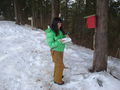
File:02954shokoRedBox.jpg Devchonka and the red box at the Kuki San.(2,048 × 1,536 (1.4 MB)) - 08:24, 1 December 2018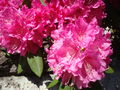
File:03493redHana.jpg Red flowers(2,048 × 1,536 (1.35 MB)) - 08:24, 1 December 2018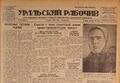
File:1938.03.06uralWorker.jpg [[Category:Red terror]](950 × 655 (818 KB)) - 08:25, 1 December 2018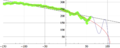
File:2014.12.29fitA300.png The red monotonous line shows the approximation(1,500 × 603 (100 KB)) - 08:26, 1 December 2018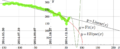
File:2014.12.29rubleDollar.png The red monotonous line represents the approximation with ellipse,(1,502 × 610 (142 KB)) - 08:26, 1 December 2018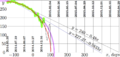
File:2014.12.31rudo.png ==Red Ellipse== The thin red curve represents the ellipse:(1,452 × 684 (190 KB)) - 08:26, 1 December 2018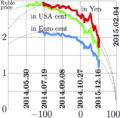
File:2014ruble15t.png Price of Russian rubble, expressed in Japanese yen (red), in the USA cents (green) and in the Euro cents (blue), versus time.(693 × 680 (110 KB)) - 08:26, 1 December 2018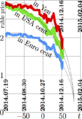
File:2014ruble17t.png in japanese yen (red)<br>(456 × 664 (98 KB)) - 08:26, 1 December 2018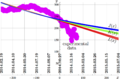
File:2014rubleDollar2param.png 10 red lines represent the linear approximations, ...a way, for function $f=L$, 10 curves are plotted, and these curve form the red strip.(1,527 × 1,004 (232 KB)) - 08:26, 1 December 2018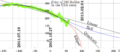
File:2014specula.png The red ellipse arc shows the function(1,502 × 651 (177 KB)) - 08:26, 1 December 2018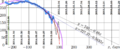
File:2015.01.01rudo.png The red ellipse represents the fit(1,660 × 684 (215 KB)) - 08:26, 1 December 2018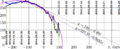
File:2015.01.03rudo.png The red sticks represent the experimental data by(1,660 × 684 (212 KB)) - 08:26, 1 December 2018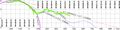
File:2016ruble1.jpg This dependence is shown with red line. This estimate is suggested 2016.01.19.(2,764 × 684 (414 KB)) - 08:27, 1 December 2018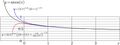
File:Amoscplot.jpg The lower red curve shows the lower asymptotic approximation,(2,092 × 780 (147 KB)) - 08:29, 1 December 2018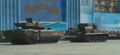
File:ArmadaTow.jpg Towing of the broken tank [[Armata]] at the Red Square, Moscow,(1,393 × 633 (28 KB)) - 08:30, 1 December 2018


