Search results
Create the page "Green" on this wiki! See also the search results found.
File:2015ruble3.jpg (thick green line).(1,726 × 684 (266 KB)) - 08:26, 1 December 2018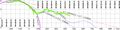
File:2016ruble1.jpg (thick green line).(2,764 × 684 (414 KB)) - 08:27, 1 December 2018
File:AlekKowal.jpg Aleksander had worn camouflage long trousers and green T-shirt with AIR print on it.(928 × 960 (77 KB)) - 08:29, 1 December 2018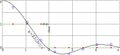
File:Bessel8TestStep.jpg shown with green line.(1,422 × 647 (88 KB)) - 08:31, 1 December 2018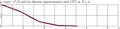
File:Cosftes04t300.jpg Explicit plot of the self-[[CosFT]] function $y\!=\!\exp(-x^2/2)$, dark green curve,(2,366 × 564 (135 KB)) - 08:32, 1 December 2018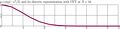
File:Cosftes16t300.jpg Explicit plot of the self–[[CosFT]] function $y\!=\!\exp(-x^2/2)$, dark green curve, ...ooth function and its discrete representation, it is barely seen; the dark green line is almost covered with the discrete approximation.(2,366 × 564 (139 KB)) - 08:32, 1 December 2018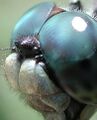
File:Dragonfly eye 3811.jpg Dragonfly with compound eyes. Author: David L. Green ...d eyes, giving them nearly a 360° field of vision. Photo credit: David L. Green(389 × 481 (51 KB)) - 08:34, 1 December 2018
File:E1e14z600.jpg fprintf(o,"0 .7 0 RGB .02 W S\n"); // green fprintf(o,"0 .7 0 RGB .02 W S\n"); // green(3,566 × 6,300 (1.85 MB)) - 08:34, 1 December 2018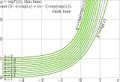
File:Exp1exp2t.jpg ...compared to the linar combination of $\exp$ and $\exp^2$, deawn with thick green lines. $y=(2\!-\!n)\exp(x)+(n\!-\!1)\exp(\exp(x))$ , and marked with thick green lines.(1,278 × 875 (296 KB)) - 08:35, 1 December 2018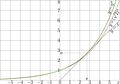
File:Expe1eplotT.jpg [[Explicit plot]] of [[exponential]] to [[base e1e]] (thick green curve) and The thick green curve is $!y\!=\!\eta^x$.(2,515 × 1,751 (350 KB)) - 08:35, 1 December 2018
File:Magaplot300.jpg Thin green curve: $~ y=\,$ [[nori]]$(x)$ $\,=\,$ [[mori]]$\big(\sqrt{x}\big)^2\,=\,$ $(4,234 × 896 (401 KB)) - 08:42, 1 December 2018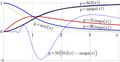
File:MagaplotFragment.jpg Thin green curve: $~ y=\,$ [[nori]]$(x)$ $\,=\,$ [[mori]]$\big(\sqrt{x}\big)^2\,=\,$ $(1,743 × 896 (245 KB)) - 08:42, 1 December 2018
File:Norifit76fragment.jpg ...om, functions [[nori]] and [[kori]], scaled with factor 10, are shown with green and red curves.(967 × 448 (155 KB)) - 08:44, 1 December 2018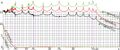
File:Norifit76plot.jpg ...om, functions [[nori]] and [[kori]], scaled with factor 10, are shown with green and red curves.(1,070 × 448 (168 KB)) - 08:44, 1 December 2018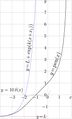
File:Penplot.jpg The thin green line shown the deviation from the linear approximation(1,266 × 2,100 (240 KB)) - 08:46, 1 December 2018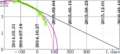
File:Roublellip.png </ref>, thick green scratched line.(1,519 × 689 (141 KB)) - 08:50, 1 December 2018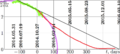
File:Ruble85210.png The green line represents the data available at the moment of preparation of the fore(1,519 × 689 (116 KB)) - 08:50, 1 December 2018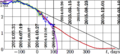
File:Ruble85210a.png The green spots represent the data available for 2014.11.29.(1,519 × 689 (217 KB)) - 08:50, 1 December 2018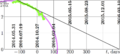
File:RubleArc.png </ref>, thick green scratched line.(1,519 × 689 (132 KB)) - 08:50, 1 December 2018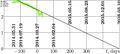
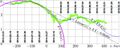
File:Rusa2014.10.28t.jpg ...the Russian Ruble evaluated in the USA pennies (cents) versus time, thick green line;<br> Since that time, the data (and thick green line) were updated few times; but the linear approximation (straight black(1,519 × 689 (167 KB)) - 08:50, 1 December 2018


