File:NasaGlobalTemperature2024compare.png
Contents
Summary
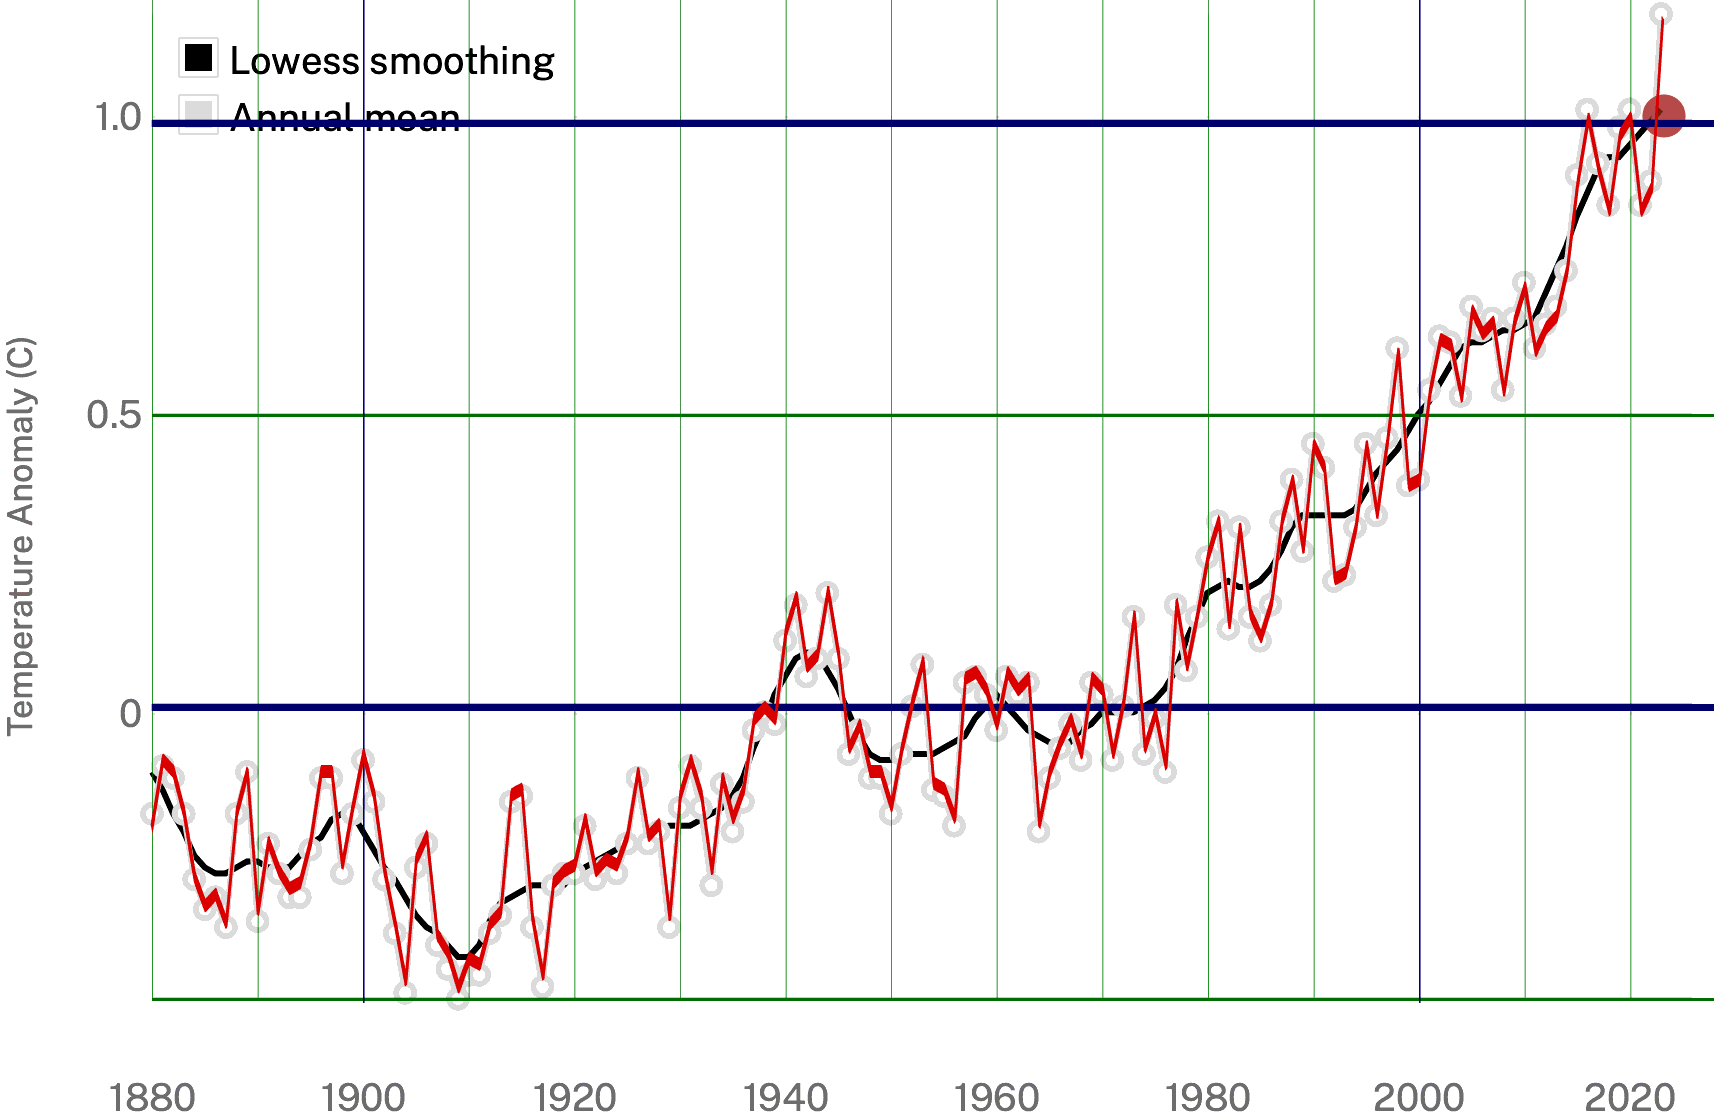
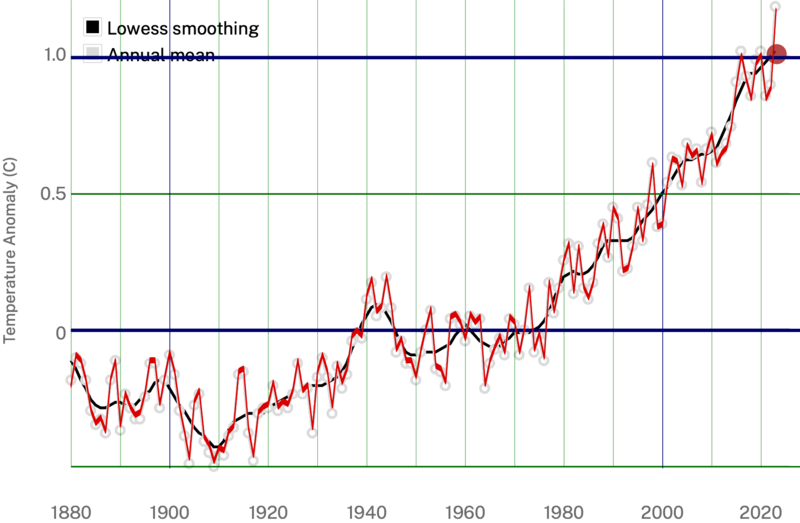
Analysis of the Global warming:
Comparison of data by NASA https://data.giss.nasa.gov/gistemp/graphs/graph_data/Global_Mean_Estimates_based_on_Land_and_Ocean_Data/graph.txt
with the screenshot of the same site at https://climate.nasa.gov/vital-signs/global-temperature/?intent=121
This screenshot is loaded as 
Initial data
Land-Ocean Temperature Index (C)
--------------------------------

Year No_Smoothing  Lowess(5)
----------------------------
1880     -0.17     -0.10
1881     -0.09     -0.13
1882     -0.11     -0.17
1883     -0.18     -0.21
1884     -0.29     -0.24
1885     -0.34     -0.27
1886     -0.32     -0.28
1887     -0.37     -0.28
1888     -0.18     -0.27
1889     -0.11     -0.26
1890     -0.35     -0.26
1891     -0.23     -0.26
1892     -0.28     -0.27
1893     -0.31     -0.26
1894     -0.30     -0.24
1895     -0.23     -0.22
1896     -0.11     -0.20
1897     -0.11     -0.18
1898     -0.27     -0.17
1899     -0.17     -0.17
1900     -0.08     -0.20
1901     -0.15     -0.23
1902     -0.28     -0.26
1903     -0.37     -0.28
1904     -0.47     -0.31
1905     -0.26     -0.34
1906     -0.22     -0.36
1907     -0.39     -0.37
1908     -0.42     -0.39
1909     -0.48     -0.41
1910     -0.43     -0.41
1911     -0.44     -0.39
1912     -0.37     -0.35
1913     -0.35     -0.33
1914     -0.15     -0.31
1915     -0.14     -0.31
1916     -0.36     -0.30
1917     -0.46     -0.30
1918     -0.30     -0.30
1919     -0.28     -0.29
1920     -0.27     -0.28
1921     -0.19     -0.26
1922     -0.28     -0.25
1923     -0.26     -0.24
1924     -0.27     -0.23
1925     -0.22     -0.22
1926     -0.11     -0.22
1927     -0.22     -0.21
1928     -0.20     -0.20
1929     -0.36     -0.19
1930     -0.15     -0.19
1931     -0.09     -0.18
1932     -0.15     -0.17
1933     -0.28     -0.16
1934     -0.12     -0.15
1935     -0.19     -0.13
1936     -0.14     -0.10
1937     -0.02     -0.06
1938      0.00     -0.01
1939     -0.02      0.03
1940      0.13      0.07
1941      0.19      0.09
1942      0.07      0.11
1943      0.09      0.10
1944      0.20      0.07
1945      0.09      0.04
1946     -0.07      0.00
1947     -0.03     -0.04
1948     -0.11     -0.07
1949     -0.11     -0.08
1950     -0.17     -0.08
1951     -0.07     -0.07
1952      0.01     -0.07
1953      0.08     -0.07
1954     -0.13     -0.06
1955     -0.14     -0.06
1956     -0.19     -0.05
1957      0.05     -0.04
1958      0.06     -0.01
1959      0.03      0.01
1960     -0.03      0.03
1961      0.06      0.01
1962      0.03     -0.01
1963      0.05     -0.03
1964     -0.20     -0.04
1965     -0.11     -0.05
1966     -0.06     -0.06
1967     -0.02     -0.05
1968     -0.08     -0.03
1969      0.05     -0.02
1970      0.03     -0.00
1971     -0.08      0.00
1972      0.01      0.00
1973      0.16     -0.00
1974     -0.07      0.01
1975     -0.01      0.02
1976     -0.10      0.04
1977      0.18      0.07
1978      0.07      0.12
1979      0.16      0.16
1980      0.26      0.20
1981      0.32      0.21
1982      0.14      0.22
1983      0.31      0.21
1984      0.16      0.21
1985      0.12      0.22
1986      0.18      0.24
1987      0.32      0.27
1988      0.39      0.31
1989      0.27      0.33
1990      0.45      0.33
1991      0.41      0.33
1992      0.22      0.33
1993      0.23      0.33
1994      0.31      0.34
1995      0.45      0.37
1996      0.33      0.40
1997      0.46      0.42
1998      0.61      0.44
1999      0.38      0.47
2000      0.39      0.50
2001      0.54      0.52
2002      0.63      0.55
2003      0.62      0.58
2004      0.53      0.61
2005      0.68      0.62
2006      0.64      0.62
2007      0.66      0.63
2008      0.54      0.64
2009      0.66      0.64
2010      0.72      0.65
2011      0.61      0.66
2012      0.65      0.70
2013      0.67      0.74
2014      0.75      0.78
2015      0.90      0.83
2016      1.01      0.87
2017      0.92      0.91
2018      0.85      0.93
2019      0.98      0.93
2020      1.01      0.95
2021      0.85      0.97
2022      0.89      0.99
2023      1.17      1.01
C++ Generator of the red curve
#include <math.h>
#include <stdio.h>
#include <stdlib.h>
#include "ado.cin"

int main(){ FILE *o; int M,m,N,n,r,Y,y; float g,h,a[2100],z;
o=fopen("01.txt","r");

for(m=0;m<240;m++)
{
r=fscanf(o,"%d%f%f",&y,&g,&h); if(r<3) break;
a[y]=g; //printf("%4d %5.2f %5.2f %5.2f\n",y,g,a[y],h);
}
fclose (o);

o=fopen("o.eps","w");
ado(o,750,120);
#define M(x,y) fprintf(o,"%6.2f %8.2f M\n",0.+x,0.+y);
#define L(x,y) fprintf(o,"%6.2f %8.2f L\n",0.+x,0.+y);
#define S() fprintf(o,"S\n");

//fprintf(o,"4 4 scale -1860 20 translate 2 setlinecap 1 setlinejoin\n");
fprintf(o,"4 4 scale -1870 10 translate 2 setlinecap 1 setlinejoin\n");

M(1880, -5) L(1880,15)
M(1890, -5) L(1890,15)

M(1910, -5) L(1910,15)
M(1920, -5) L(1920,15)
M(1930, -5) L(1930,15)
M(1940, -5) L(1940,15)
M(1950, -5) L(1950,15)
M(1960, -5) L(1960,15)
M(1970, -5) L(1970,15)
M(1980, -5) L(1980,15)
M(1990, -5) L(1990,15)
M(2010, -5) L(2010,15)

M(2020, -5) L(2020,15)
M(2030, -5) L(2030,15)
M(2040, -5) L(2040,15)
M(2050, -5) L(2050,15)

M(1880, 15) L(2050,15)
M(1880, 5) L(2050,5)
M(1880, -5) L(2050,-5)

fprintf(o,"0.05 setlinewidth 0 .4 0 RGB S\n");

M(1900, -5) L(1900,15)
M(2000, -5) L(2000,15)

//M(1880, 20) L(2050,20)
M(1880, 10) L(2050,10)
M(1880, 0) L(2050,0)
//M(1880, -10) L(2050,-10)

fprintf(o,"0.12 setlinewidth 0 0 .4 RGB S\n");

fprintf(o,"%4d %4.0f M\n",1880,10*a[1880]);
for(y=1881;y<2024;y++) L(y,10*a[y])

fprintf(o,"0.22 setlinewidth .8 0 0 RGB S\n");

fprintf(o,"showpage\n%c%cTrailer",'%','%'); fclose(o);
     system("epstopdf o.eps");
     system("open o.pdf");
Latex combiner (o3.tex)
\documentclass{standalone}
\usepackage{graphicx}
\begin{document}
%\begin{picture}(1692,1113)
\begin{picture}(1720,1124)
\put(0,0){\includegraphics{NasaGlobalTemperature2024big.png}}
\put(47,-172){\scalebox{2.64}[14.6]{\includegraphics{o.eps}}}
\end{picture}
\end{document}
Agreement
The qualitative agreement should be mentioned.
The deviation of values returned by the animation
from the text version of the data
is of order of 0.01 degree of Celsius.
There is no hint to guess, which data are more precise, those from the table or those from the animation.
Editor hopes, the deviation mentioned does not affect result of the analysis of the statistical significance of the forecast about the catastrophic warning.
References
https://data.giss.nasa.gov/gistemp/graphs/graph_data/Global_Mean_Estimates_based_on_Land_and_Ocean_Data/graph.txt original year 2024
https://climate.nasa.gov/vital-signs/global-temperature/?intent=121 source of the screenshot, year 2024
Keywords
File history
Click on a date/time to view the file as it appeared at that time.
| Date/Time | Thumbnail | Dimensions | User | Comment | |
|---|---|---|---|---|---|
| current | 07:19, 4 August 2024 | | 1,714 × 1,120 (67 KB) | T (talk | contribs) | {{oq|NasaGlobalTemperature2024compare|NasaGlobalTemperature2024compare.png [1714x1120+0+0]}} Analysis of the Global warming: Comparison of data by NASA https://data.giss.nasa.gov/gistemp/graphs/graph_data/Global_Mean_Estimates_based_on_Land_and_Ocean... |
- You cannot overwrite this file.
File usage
There are no pages that link to this file.