File:WarmingNASAquadratic2024.png

Contents
Summary
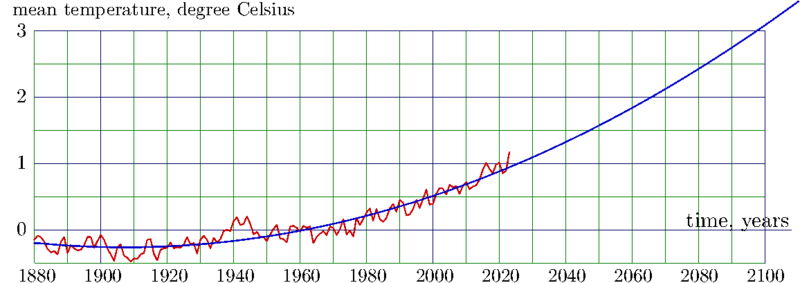
Global warming: data for the «Mean temperature» by NASA at year 2024
and their quadratic approximation
fir(t) = 0.50957748 + t*(0.01669969 + t*0.00009021 );
Where t=y-2000
and y is time measured in years.
Data
https://data.giss.nasa.gov/gistemp/graphs/graph_data/Global_Mean_Estimates_based_on_Land_and_Ocean_Data/graph.txt (2024) Land-Ocean Temperature Index (C)
Year No_Smoothing Lowess(5)
1880     -0.17     -0.10
1881     -0.09     -0.13
1882     -0.11     -0.17
1883     -0.18     -0.21
1884     -0.29     -0.24
1885     -0.34     -0.27
1886     -0.32     -0.28
1887     -0.37     -0.28
1888     -0.18     -0.27
1889     -0.11     -0.26
1890     -0.35     -0.26
1891     -0.23     -0.26
1892     -0.28     -0.27
1893     -0.31     -0.26
1894     -0.30     -0.24
1895     -0.23     -0.22
1896     -0.11     -0.20
1897     -0.11     -0.18
1898     -0.27     -0.17
1899     -0.17     -0.17
1900     -0.08     -0.20
1901     -0.15     -0.23
1902     -0.28     -0.26
1903     -0.37     -0.28
1904     -0.47     -0.31
1905     -0.26     -0.34
1906     -0.22     -0.36
1907     -0.39     -0.37
1908     -0.42     -0.39
1909     -0.48     -0.41
1910     -0.43     -0.41
1911     -0.44     -0.39
1912     -0.37     -0.35
1913     -0.35     -0.33
1914     -0.15     -0.31
1915     -0.14     -0.31
1916     -0.36     -0.30
1917     -0.46     -0.30
1918     -0.30     -0.30
1919     -0.28     -0.29
1920     -0.27     -0.28
1921     -0.19     -0.26
1922     -0.28     -0.25
1923     -0.26     -0.24
1924     -0.27     -0.23
1925     -0.22     -0.22
1926     -0.11     -0.22
1927     -0.22     -0.21
1928     -0.20     -0.20
1929     -0.36     -0.19
1930     -0.15     -0.19
1931     -0.09     -0.18
1932     -0.15     -0.17
1933     -0.28     -0.16
1934     -0.12     -0.15
1935     -0.19     -0.13
1936     -0.14     -0.10
1937     -0.02     -0.06
1938      0.00     -0.01
1939     -0.02      0.03
1940      0.13      0.07
1941      0.19      0.09
1942      0.07      0.11
1943      0.09      0.10
1944      0.20      0.07
1945      0.09      0.04
1946     -0.07      0.00
1947     -0.03     -0.04
1948     -0.11     -0.07
1949     -0.11     -0.08
1950     -0.17     -0.08
1951     -0.07     -0.07
1952      0.01     -0.07
1953      0.08     -0.07
1954     -0.13     -0.06
1955     -0.14     -0.06
1956     -0.19     -0.05
1957      0.05     -0.04
1958      0.06     -0.01
1959      0.03      0.01
1960     -0.03      0.03
1961      0.06      0.01
1962      0.03     -0.01
1963      0.05     -0.03
1964     -0.20     -0.04
1965     -0.11     -0.05
1966     -0.06     -0.06
1967     -0.02     -0.05
1968     -0.08     -0.03
1969      0.05     -0.02
1970      0.03     -0.00
1971     -0.08      0.00
1972      0.01      0.00
1973      0.16     -0.00
1974     -0.07      0.01
1975     -0.01      0.02
1976     -0.10      0.04
1977      0.18      0.07
1978      0.07      0.12
1979      0.16      0.16
1980      0.26      0.20
1981      0.32      0.21
1982      0.14      0.22
1983      0.31      0.21
1984      0.16      0.21
1985      0.12      0.22
1986      0.18      0.24
1987      0.32      0.27
1988      0.39      0.31
1989      0.27      0.33
1990      0.45      0.33
1991      0.41      0.33
1992      0.22      0.33
1993      0.23      0.33
1994      0.31      0.34
1995      0.45      0.37
1996      0.33      0.40
1997      0.46      0.42
1998      0.61      0.44
1999      0.38      0.47
2000      0.39      0.50
2001      0.54      0.52
2002      0.63      0.55
2003      0.62      0.58
2004      0.53      0.61
2005      0.68      0.62
2006      0.64      0.62
2007      0.66      0.63
2008      0.54      0.64
2009      0.66      0.64
2010      0.72      0.65
2011      0.61      0.66
2012      0.65      0.70
2013      0.67      0.74
2014      0.75      0.78
2015      0.90      0.83
2016      1.01      0.87
2017      0.92      0.91
2018      0.85      0.93
2019      0.98      0.93
2020      1.01      0.95
2021      0.85      0.97
2022      0.89      0.99
2023      1.17      1.01
C++ generator of curves
// ado.cin should be loaded in order to compile the code below
#include <math.h>
#include <stdio.h>
#include <stdlib.h>
#include "ado.cin"

#define DB double
DB f32(int y){ DB t=y-2000.; return
0.50957748 + t*(
0.01669969 + t*
0.00009021 );
}

int main(){ FILE *o; int M,m,N,n,r,Y,y; float g,h,a[2100],z;
o=fopen("../01.txt","r");

for(m=0;m<240;m++)
{
r=fscanf(o,"%d%f%f",&y,&g,&h); if(r<3) break;
a[y]=g; //printf("%4d %5.2f %5.2f %5.2f\n",y,g,a[y],h);
}
fclose (o);

o=fopen("3o.eps","w");
//ado(o,750,220);
ado(o,1000,400);
#define M(x,y) fprintf(o,"%6.2f %8.2f M\n",0.+x,0.+y);
#define L(x,y) fprintf(o,"%6.2f %8.2f L\n",0.+x,0.+y);
#define S() fprintf(o,"S\n");

//fprintf(o,"4 4 scale -1860 20 translate 2 setlinecap 1 setlinejoin\n");
fprintf(o,"4 4 scale -1870 20 translate 2 setlinecap 1 setlinejoin\n");

M(1880, -10) L(1880,60)
M(1890, -10) L(1890,60)

M(1910, -10) L(1910,60)
M(1920, -10) L(1920,60)
M(1930, -10) L(1930,60)
M(1940, -10) L(1940,60)
M(1950, -10) L(1950,60)
M(1960, -10) L(1960,60)
M(1970, -10) L(1970,60)
M(1980, -10) L(1980,60)
M(1990, -10) L(1990,60)
M(2010, -10) L(2010,60)

M(2020, -10) L(2020,60)
M(2030, -10) L(2030,60)
M(2040, -10) L(2040,60)
M(2050, -10) L(2050,60)
M(2060, -10) L(2060,60)
M(2070, -10) L(2070,60)
M(2080, -10) L(2080,60)
M(2090, -10) L(2090,60)

M(1880, 50) L(2100,50)
M(1880, 30) L(2100,30)
M(1880, 10) L(2100,10)
M(1880,-10) L(2100,-10)

fprintf(o,"0.09 setlinewidth 0 .5 0 RGB S\n");

M(1900, -10) L(1900,60)
M(2000, -10) L(2000,60)
M(2100, -10) L(2100,60)

M(1880, 60) L(2100,60)
M(1880, 40) L(2100,40)
M(1880, 20) L(2100,20)
M(1880, 0) L(2108,0)
//M(1880, -20) L(2050,-20)

fprintf(o,"0.12 setlinewidth 0 0 .4 RGB S\n");

fprintf(o,"%4d %4.0f M\n",1880,20*a[1880]);
for(y=1881;y<2024;y++) L(y,20*a[y])
fprintf(o,"0.4 setlinewidth .8 0 0 RGB S\n");

fprintf(o,"%4d %4.0f M\n",1880,20*f32(1880));
for(y=1881;y<2111;y++) L(y,20*f32(y))
fprintf(o,"0.44 setlinewidth 0 0 .8 RGB S\n");

fprintf(o,"showpage\n%c%cTrailer",'%','%'); fclose(o);
     system("epstopdf 3o.eps");
     system("open 3o.pdf");
}
Latex generator of labels
%File 3o.eps should be generated with the code above in order to Latex the generator below.
\documentclass{standalone}
\usepackage{graphicx}
\newcommand \sx {\scalebox}
\begin{document}
%\scalebox{2}[3]
\scalebox{1.2}
{
\begin{picture}(960,342)
%\put(-18,6){\scalebox{0.3793}[0.135]{\includegraphics{../NasaGlobalTemperature2024big.png}}}
\put(-2,-16){\includegraphics{3o.eps}}
\put(12,324){\sx{2.3}{mean temperature, degree Celsius}}
\put(17,298){\sx{2.4}{$3$}}
%\put(7,258){\sx{2.2}{$2.5$}}
\put(17,218){\sx{2.4}{$2$}}
%\put(7,178){\sx{2.2}{$1.5$}}
\put(17,138){\sx{2.4}{$1$}}
%\put(7,98){\sx{2.2}{$0.5$}}
\put(826,68){\sx{2.6}{time, years}}
\put(17,58){\sx{2.4}{$0$}}
%\put(-6, 19){\sx{2.2}{$-0.5$}}
\put(18,  2){\sx{2.3}{$1880$}}
\put(98,  2){\sx{2.3}{$1900$}}
\put(178,  2){\sx{2.3}{$1920$}}
\put(258,  2){\sx{2.3}{$1940$}}
%\put(300,  2){\sx{1.9}{$1950$}}
\put(338,  2){\sx{2.3}{$1960$}}
\put(418,  2){\sx{2.3}{$1980$}}
\put(499,  2){\sx{2.3}{$2000$}}
\put(579,  2){\sx{2.3}{$2020$}}
\put(659,  2){\sx{2.3}{$2040$}}
\put(739,  2){\sx{2.3}{$2060$}}
\put(819,  2){\sx{2.3}{$2080$}}
\put(899,  2){\sx{2.3}{$2100$}}
\end{picture}
\end{document}
Speculations
Since year 1990, many authors use to writhe about the global warning, providing no data (nor even link to these data) that would allow them to declare that the mean temperature at the Earth shows significant rise. That made the impression that all the bzz bout the global warming is just a fiction and misinformation.
In 2024, the data for some «average temperature» are observed at https://data.giss.nasa.gov/gistemp/graphs/graph_data/Global_Mean_Estimates_based_on_Land_and_Ocean_Data/graph.txt
Since that, the concept «Global warming» can be reconsidered. The loading of the primitive fitting above begins such a reconsideration.
A the scale of some tens years, the initial data look smooth; the temperature varies slowly.
The quadratic approximation shows good agreements; the parabola crosses the experimental red curve many times.
The increase of the «mean temperatire» can be interpreted in many ways. Some of them are mentioned below.
Observational selection
New meteorologic stations are installed in the tropical areas. There, the temperature is usually higher, than in the polar ares.
Sun and tectonics
Variation of liminosity of Sun and tectonic activity of the Earth cause smooth variations of temperature,
One may expect the temperature to remain higher than temperature of boiling of air at the atmospheriv pressure, but lower, that temperature of boiling of water.
wars
At the wars, a lot of staff burned; the ache covers the snow at winter and boost the melting.
Indeed,some humps are observed at the
World War I (1014),
World War II (1939),
Soiet invasion into Afghanistan (1979),
Chechen wars (1994,1999)
Russian invasion into Uraine (2014,2022)
However, these humps look not so significant,
and is is difficult to guess,
either the extra solar light provokes the aggression
or a war produces a lot of ache that reduces the reflectivity of snow at winter.
Alarmism
Several authors pretend that the mean temperature grows due to the industrialization of the human civilization.
Tha main claim are:
1. The reduction of consumption of coal, oil and gas may slow down the warning and prolong the agony of the Human civilization at hot Earth.
2. The activity of alarmists may help to reduce the consumption and therefore such an activity should be sponsored.
References
https://data.giss.nasa.gov/gistemp/graphs/graph_data/Global_Mean_Estimates_based_on_Land_and_Ocean_Data/graph.txt (2024) Land-Ocean Temperature Index (C)
https://climate.nasa.gov/vital-signs/global-temperature/?intent=121 Global Temperature LATEST ANNUAL AVERAGE ANOMALY: 2023 1.17 °C 2.11 °F This graph shows the change in global surface temperature compared to the long-term average from 1951 to 1980. Earth’s average surface temperature in 2023 was the warmest on record since recordkeeping began in 1880 (source: NASA/GISS). NASA’s analysis generally matches independent analyses prepared by the National Oceanic and Atmospheric Administration (NOAA) and other research groups. Overall, Earth was about 2.45 degrees Fahrenheit (or about 1.36 degrees Celsius) warmer in 2023 than in the late 19th-century (1850-1900) preindustrial average. The 10 most recent years are the warmest on record. // The animation on the right shows the change in global surface temperatures. Dark blue shows areas cooler than average. Dark red shows areas warmer than average. Short-term variations are smoothed out using a 5-year running average to make trends more visible in this map. // The data shown are the latest available, updated annually.
Keywords
«[[]]», «Global warming», «KandidKun», «Minimization», «[[]]»,
File history
Click on a date/time to view the file as it appeared at that time.
| Date/Time | Thumbnail | Dimensions | User | Comment | |
|---|---|---|---|---|---|
| current | 07:25, 4 August 2024 | 1,156 × 409 (16 KB) | T (talk | contribs) | == Summary == {{oq|WarmingNASAquadratic2024.png|}} Global warming: data for the «Mean temperature» by NASA at year 2024 and their quadratic approximation fir(t) = 0.50957748 + t*(0.01669969 + t*0.00009021 ); Where t=y-2000 and y is time... |
- You cannot overwrite this file.
File usage
There are no pages that link to this file.