Difference between revisions of "File:2014.12.26rubleDollar.png"
(Importing image file) |
|||
| Line 1: | Line 1: | ||
| + | Price of 100 ruddian rubles, measured in the USA cents; data for the end of year 2014 |
||
| − | Importing image file |
||
| + | and the approximations with elementary functions. |
||
| + | |||
| + | |||
| + | The green thick curve represents the experimental data |
||
| + | $y=g(x)=\mathrm{Measured}(x)$ |
||
| + | by https://www.mataf.net/en/currency/converter-USD-RUB ; |
||
| + | coordinate $x$ has sense of time, measured in days since the date of beginning of the project, |
||
| + | 2014,10,27. |
||
| + | |||
| + | For each datum stored for specified year,month,day, the time $x$ is evaluated as |
||
| + | |||
| + | $x = \rm |
||
| + | daju24(year,month, day)- |
||
| + | daju24(2014,10, 27)$ |
||
| + | |||
| + | with function daju24 defined below in C++: \begin{verbatim} |
||
| + | <poem> |
||
| + | int daju24(int Y,int M, int D){ int a, y, m; |
||
| + | a = (14-M)/12; |
||
| + | y = Y + 4800 - a; |
||
| + | m = M + 12*a - 3; |
||
| + | return D + (153*m+2)/5 + 365*y + y/4 - y/100 + y/400 - 32045 - 2400000; } |
||
| + | </poem> |
||
| + | |||
| + | These data are stored as array $\{x_n,g_n\}, \{n,1,M\}$, |
||
| + | where $M$ is total number of experimental data. Approximating functions are specified below: |
||
| + | |||
| + | $ |
||
| + | \begin{array}{c|l|r|r} |
||
| + | \rm Label &~ ~ ~ ~ ~ f(x) & D ~ ~ & Q ~ ~\\ |
||
| + | \hline |
||
| + | \rm Linear &227.323 - 0.583872 x &\! 10.52733 &\! 13.15973\\ |
||
| + | %{227.32289289657714` - 0.5838719175561293` x, 10.52725166548383`, 13.15967254961913`} |
||
| + | \rm Qu\! & 233.214 - 0.908933 x - 0.00361841 x^2 & 3.94609& 5.84960\\ |
||
| + | %3.946087936982961`, 5.849600340588587 |
||
| + | \rm Ellipse &~ ~ ~ ~ ~ ~ ~ ~ ~ ~ ~ ~ ~ ~ ~ ~ 1.19332 \sqrt{(99.8879 - x) (388.557 + x)} & 3.72305 & 5.74477\\ |
||
| + | \rm Ed & -96.8595 + 1.46555 \sqrt{(127.305 - x) (401.761 + x)} & 3.74359 & 5.71801\\ |
||
| + | \rm Cu & 234.636 - 0.905604 x - 0.00456087 x^2 - 6.98113\!\times\!10^{-6}~ x^3 & 3.77297 & 5.72430\\ |
||
| + | \rm Bell & 291.207 / \cosh(0.715005 + 0.00630878 x)& 4.91540& 6.96990\\ |
||
| + | \rm Gauss & 290.656 \exp\Big(-0.0000168642 (116.58 + x)^2\Big) & 4.45347&6.43202\\ |
||
| + | \rm Dex &\!\! 100/\Big(0.337261 \exp(0.000020293 x) + 0.0881639 \exp(0.0189706 x)\Big) \!& 3.79927& 5.72350\\ |
||
| + | \hline |
||
| + | \end{array} |
||
| + | $ |
||
| + | |||
| + | The last two columns of the table above characterise the precision of each approximation: |
||
| + | |||
| + | $\displaystyle D= \frac{1}{M} \sum_{n=1}^{M} |f(x_n)-g_n|$ |
||
| + | |||
| + | $\displaystyle Q= \sqrt{\frac{1}{M} \sum_{n=1}^{M} (f(x_n)-g_n)^2}$ |
||
| + | |||
| + | These quantities refer to date 2014.12.26; $M=209$. |
||
| + | |||
| + | ==Refrerences== |
||
| + | <references/> |
||
| + | |||
| + | http://mizugadro.mydns.jp/PAPERS/2015ruble.pdf |
||
| + | D.Kouznetsov. Fitting of economical data with elementary functions: rouble versus dollar in 2014. |
||
| + | |||
| + | [[Category:Approximation of rubble]] |
||
| + | [[Category:Ruble]] |
||
| + | [[Category:Rouble]] |
||
| + | [[Category:Inflation]] |
||
| + | [[Category:Russia]] |
||
| + | [[Category:Corruption]] |
||
| + | [[Category:Implicit plot]] |
||
Latest revision as of 08:26, 1 December 2018
Price of 100 ruddian rubles, measured in the USA cents; data for the end of year 2014 and the approximations with elementary functions.
The green thick curve represents the experimental data
$y=g(x)=\mathrm{Measured}(x)$
by https://www.mataf.net/en/currency/converter-USD-RUB ;
coordinate $x$ has sense of time, measured in days since the date of beginning of the project,
2014,10,27.
For each datum stored for specified year,month,day, the time $x$ is evaluated as
$x = \rm daju24(year,month, day)- daju24(2014,10, 27)$
with function daju24 defined below in C++: \begin{verbatim} '"`UNIQ--poem-00000000-QINU`"' These data are stored as array $\{x_n,g_n\}, \{n,1,M\}$, where $M$ is total number of experimental data. Approximating functions are specified below: $ \begin{array}{c|l|r|r} \rm Label &~ ~ ~ ~ ~ f(x) & D ~ ~ & Q ~ ~\\ \hline \rm Linear &227.323 - 0.583872 x &\! 10.52733 &\! 13.15973\\ %{227.32289289657714` - 0.5838719175561293` x, 10.52725166548383`, 13.15967254961913`} \rm Qu\! & 233.214 - 0.908933 x - 0.00361841 x^2 & 3.94609& 5.84960\\ %3.946087936982961`, 5.849600340588587 \rm Ellipse &~ ~ ~ ~ ~ ~ ~ ~ ~ ~ ~ ~ ~ ~ ~ ~ 1.19332 \sqrt{(99.8879 - x) (388.557 + x)} & 3.72305 & 5.74477\\ \rm Ed & -96.8595 + 1.46555 \sqrt{(127.305 - x) (401.761 + x)} & 3.74359 & 5.71801\\ \rm Cu & 234.636 - 0.905604 x - 0.00456087 x^2 - 6.98113\!\times\!10^{-6}~ x^3 & 3.77297 & 5.72430\\ \rm Bell & 291.207 / \cosh(0.715005 + 0.00630878 x)& 4.91540& 6.96990\\ \rm Gauss & 290.656 \exp\Big(-0.0000168642 (116.58 + x)^2\Big) & 4.45347&6.43202\\ \rm Dex &\!\! 100/\Big(0.337261 \exp(0.000020293 x) + 0.0881639 \exp(0.0189706 x)\Big) \!& 3.79927& 5.72350\\ \hline \end{array} $
The last two columns of the table above characterise the precision of each approximation:
$\displaystyle D= \frac{1}{M} \sum_{n=1}^{M} |f(x_n)-g_n|$
$\displaystyle Q= \sqrt{\frac{1}{M} \sum_{n=1}^{M} (f(x_n)-g_n)^2}$
These quantities refer to date 2014.12.26; $M=209$.
Refrerences
http://mizugadro.mydns.jp/PAPERS/2015ruble.pdf
D.Kouznetsov. Fitting of economical data with elementary functions: rouble versus dollar in 2014.
File history
Click on a date/time to view the file as it appeared at that time.
| Date/Time | Thumbnail | Dimensions | User | Comment | |
|---|---|---|---|---|---|
| current | 06:09, 1 December 2018 | 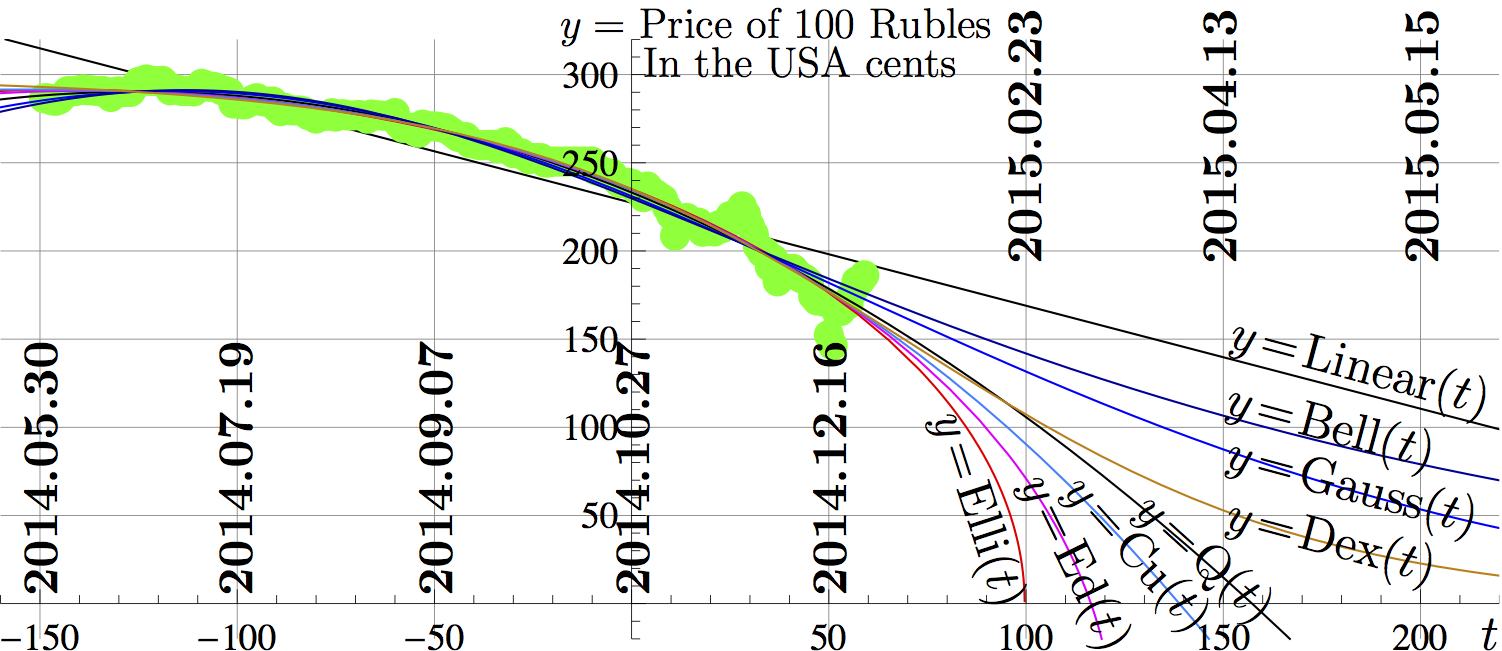 | 1,502 × 651 (246 KB) | Maintenance script (talk | contribs) | Importing image file |
- You cannot overwrite this file.
File usage
The following page links to this file: