Difference between revisions of "File:Fukushima 180511.jpg"
(Importing image file) |
|||
| Line 1: | Line 1: | ||
| + | Map of deposition of radiocaesium (sum of Cs-134 and Cs-137) for the land area within 80 km of the Fukushima Daiichi plant, as reported by the Japanese authorities (MEXT), 2011 May 20. |
||
| − | Importing image file |
||
| + | |||
| + | The scale levels of contamination becomes readable the strong zooming-in of the upper right corner. The following notations are used: |
||
| + | |||
| + | contamination from $3\,\mathrm{MBq/m^2}$ to $30 \, \mathrm{MBq/m^2}$ |
||
| + | is marked with red; |
||
| + | |||
| + | contamination from $1\,\mathrm{MBq/m^2}$ to $3 \, \mathrm{MBq/m^2}$ |
||
| + | is marked with yellow; |
||
| + | |||
| + | contamination from $0.6\,\mathrm{MBq/m^2}$ to $1 \, \mathrm{MBq/m^2}$ |
||
| + | is marked with green; |
||
| + | |||
| + | contamination from $0.3\,\mathrm{MBq/m^2}$ to $0.6 \, \mathrm{MBq/m^2}$ |
||
| + | is marked with cyan; |
||
| + | |||
| + | Regions with contamination less than $0.3 \, \mathrm{MBq/m^2}$ are painted with dark blue. |
||
| + | |||
| + | The ocean that does not keep the high concentration of depsited isotopes is painted with light blue. |
||
| + | |||
| + | [[File:Fukushima-ground-ra7.jpg|110px|right]] |
||
| + | Perhaps, the data about counting of beta-particles were recalculated to the surface density of contamination |
||
| + | under assumption that the main contaminant is unstable cesium. It can be revealed comparing the map above to that at right, assuming that the intensity of ionizing radiation is proportional to the surface density of contamination. The comparison shows that roughly, |
||
| + | 1 mega Becquerel deposited per each square meter of the ground produces the ionizing radiation in amount of order of 3.1 microSievers per hour. |
||
| + | |||
| + | Becquerel means one decay per second; MegaBequerel means million decays per second. |
||
| + | Roughly, at the edge of the green and yellow, from each square meter, of order of million beta–particles are produced. |
||
| + | Half of them are supposed to go deeply into the ground; another half produces approximately 3 microSieverts per hour. |
||
| + | |||
| + | One Sievert means that one Joule/kg of the human body is brought with the high energy particles; this amount causes human illness with the |
||
| + | statistically-significant probability. |
||
| + | |||
| + | Roughly, those who live at the edge of green and yellow (1MBq), are expected to get the illness within 300,000 hours (if they eat clean products); this corresponds to tens of years. It is not so heathy, but not very dangerous. One may hope, the most of the isotopes are in the dust; in a cities, after several serious rains, the most or this dust will be washed out to the rivers and to the Ocean. As for the soil... One needs to see detailed map of the distribution of the unstable isotopes that form that 1 MBq/m^2 in order to make the predictions. Perhaps, the plants grown up in that area can be identified with a [[Geiger counter]], and they not good as a food. |
||
| + | The genetic modifications (mutations) of the Human population in that region may cause the statistically-significant raise of mortality within few next generations. (But the same sad reason also may boost the appearance of individuals with outstanding scientific abilities at the appropriate education.) |
||
| + | |||
| + | It would be interesting to compare this map to a map plotted on the base of the ground measurements. |
||
| + | |||
| + | At the reuse, please, attribute the source: http://www.iaea.org/newscenter/news/tsunamiupdate01.html |
||
| + | Fukushima Nuclear Accident Update Log. Staff Report, Updates of 12 - 18 May 2011; Last update: 23 May 2011. |
||
| + | |||
| + | ==Similar maps== |
||
| + | [[File:Fukushima_180511.jpg|90px]] |
||
| + | [[File:Fukushima-ground-ra7.jpg|90px]][[File:Fukushima-ground-radiation.jpg |150px]][[File:Radiation-map-fukushima1.jpg|80px]] |
||
| + | [[File:Newton2011 7 27b.jpg|90px]] [[File:Si-radiation-thumb-200xauto-6005b.jpg|150px]] |
||
| + | [[File:4t1.jpg|70px]] |
||
| + | |||
| + | [[Category:Fukushima disaster]] |
||
| + | [[Category:Maps]] |
||
| + | [[Category:Maps of contamination]] |
||
| + | [[Category:Nuclear accidents]] |
||
Latest revision as of 09:38, 21 June 2013
Map of deposition of radiocaesium (sum of Cs-134 and Cs-137) for the land area within 80 km of the Fukushima Daiichi plant, as reported by the Japanese authorities (MEXT), 2011 May 20.
The scale levels of contamination becomes readable the strong zooming-in of the upper right corner. The following notations are used:
contamination from $3\,\mathrm{MBq/m^2}$ to $30 \, \mathrm{MBq/m^2}$ is marked with red;
contamination from $1\,\mathrm{MBq/m^2}$ to $3 \, \mathrm{MBq/m^2}$ is marked with yellow;
contamination from $0.6\,\mathrm{MBq/m^2}$ to $1 \, \mathrm{MBq/m^2}$ is marked with green;
contamination from $0.3\,\mathrm{MBq/m^2}$ to $0.6 \, \mathrm{MBq/m^2}$ is marked with cyan;
Regions with contamination less than $0.3 \, \mathrm{MBq/m^2}$ are painted with dark blue.
The ocean that does not keep the high concentration of depsited isotopes is painted with light blue.

Perhaps, the data about counting of beta-particles were recalculated to the surface density of contamination under assumption that the main contaminant is unstable cesium. It can be revealed comparing the map above to that at right, assuming that the intensity of ionizing radiation is proportional to the surface density of contamination. The comparison shows that roughly, 1 mega Becquerel deposited per each square meter of the ground produces the ionizing radiation in amount of order of 3.1 microSievers per hour.
Becquerel means one decay per second; MegaBequerel means million decays per second. Roughly, at the edge of the green and yellow, from each square meter, of order of million beta–particles are produced. Half of them are supposed to go deeply into the ground; another half produces approximately 3 microSieverts per hour.
One Sievert means that one Joule/kg of the human body is brought with the high energy particles; this amount causes human illness with the statistically-significant probability.
Roughly, those who live at the edge of green and yellow (1MBq), are expected to get the illness within 300,000 hours (if they eat clean products); this corresponds to tens of years. It is not so heathy, but not very dangerous. One may hope, the most of the isotopes are in the dust; in a cities, after several serious rains, the most or this dust will be washed out to the rivers and to the Ocean. As for the soil... One needs to see detailed map of the distribution of the unstable isotopes that form that 1 MBq/m^2 in order to make the predictions. Perhaps, the plants grown up in that area can be identified with a Geiger counter, and they not good as a food. The genetic modifications (mutations) of the Human population in that region may cause the statistically-significant raise of mortality within few next generations. (But the same sad reason also may boost the appearance of individuals with outstanding scientific abilities at the appropriate education.)
It would be interesting to compare this map to a map plotted on the base of the ground measurements.
At the reuse, please, attribute the source: http://www.iaea.org/newscenter/news/tsunamiupdate01.html Fukushima Nuclear Accident Update Log. Staff Report, Updates of 12 - 18 May 2011; Last update: 23 May 2011.
Similar maps


File history
Click on a date/time to view the file as it appeared at that time.
| Date/Time | Thumbnail | Dimensions | User | Comment | |
|---|---|---|---|---|---|
| current | 17:50, 20 June 2013 | 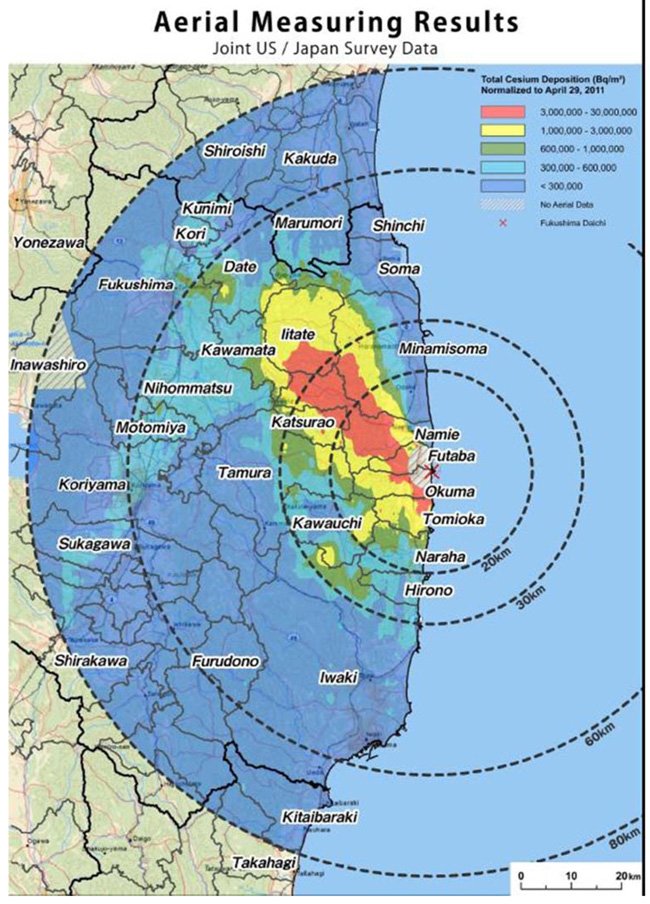 | 650 × 904 (255 KB) | Maintenance script (talk | contribs) | Importing image file |
- You cannot overwrite this file.
File usage
The following 5 pages link to this file: