File:TetPlotU.png

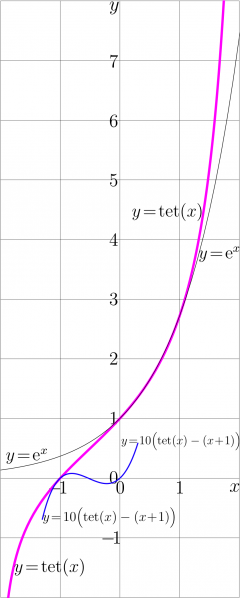
Explicit plot of tetration to base e; $y=\mathrm{tet}(x)$ is shown with thick pink line.
For comparison, the thin black line shows the exponential, $y=\exp(x)$
For $x$ between $-1$ and $0$, the graphic of tetration $y\!=\!\mathrm{tet}(x)$ looks similar to that of linear function $y\!=\!x\!+\!1$. The difference between these two functions, scaled with factor 10, id est, $y=10\Big( \mathrm{tet}(x)-(x+1)\Big)$, is plotted with blue curve of intermediate thickness. (It would be difficult to see the difference without scaling).
Between $0$ and $1$, the graphic of tetration $y\!=\!\mathrm{tet}(x)$ looks similar to that of the exponential function $y\!=\!\exp(x)$. These curves cross three times, at $x\!=\!0$, at $x\!=\!x_{\rm half}\!\approx\! 0.47$ and at $x\!=\!1$.
Correspondently, the thick pink curve for $y\!=\!\mathrm{tet}(x)$ woud cross the graphic $~y=x\!+\!1~$ at $x\!=\!x_{\rm half}\!-\!1\!\approx\!-0.53$ , and at this value, the difference $\mathrm{tet}(x) - (x\!+\!1)$ becomes zero.
References
C++ generator of curves
// files fsexp.cin, fslog.cin and ado.cin should be loaded to the working directory in order to compile the C++ code below:
#include <math.h>
#include <stdio.h>
#include <stdlib.h>
#define DB double
#define DO(x,y) for(x=0;x<y;x++)
using namespace std;
#include <complex>
typedef complex<double> z_type;
#define Re(x) x.real()
#define Im(x) x.imag()
#define I z_type(0.,1.)
#include "ado.cin"
#include "fslog.cin"
#include "fsexp.cin"
main(){ int j,k,m,n; DB x,y, p,q, t; z_type z,c,d;
int M=400,M1=M+1;
int N=401,N1=N+1;
DB X[M1],Y[N1], g[M1*N1],f[M1*N1], w[M1*N1]; // w is working array.
char v[M1*N1]; // v is working array
FILE *o;o=fopen("TetPlot.eps","w");ado(o,402,1002);
fprintf(o,"201 201 translate\n 100 100 scale\n");
#define M(x,y) fprintf(o,"%7.4f %7.4f M\n",0.+x,0.+y);
#define L(x,y) fprintf(o,"%7.4f %7.4f L\n",0.+x,0.+y);
fprintf(o,"1 setlinejoin 2 setlinecap\n");
for(m=-2;m<3;m++){M(m,-2)L(m,8)}
for(n=-2;n<11;n++){M(-2,n)L(2,n)} fprintf(o,".004 W S\n");
DO(m,101){y=-2.+.1*m; x=Re(FSLOG(y)); printf("%4.3f %4.3f \n",x,y); if(m==0)M(x,y) else L(x,y);}
fprintf(o,".04 W 1 0 1 RGB S\n");
DO(m,44){x=-2.+.1*m; y=exp(x); printf("%4.3f %4.3f \n",x,y); if(m==0)M(x,y) else L(x,y);}
fprintf(o,".008 W 0 0 0 RGB S\n");
DO(m,161){x=-1.3+.01*m; y=Re(FSEXP(x))-(1.+x); y*=10; printf("%4.3f %4.3f \n",x,y); if(m==0)M(x,y) else L(x,y);}
fprintf(o,".02 W 0 0 1 RGB S\n");
fprintf(o,"showpage\n%c%cTrailer",'%','%'); fclose(o);
system("epstopdf TetPlot.eps");
system(    "open TetPlot.pdf"); //for mac
getchar(); system("killall Preview"); // for mac
}
// Copyleft 2012 by Dmitrii Kouznetsov
Latex benerator of labels
% % <br> \documentclass[12pt]{article} % <br> \paperheight 1002px % <br> \paperwidth 402px % <br> \textwidth 1294px % <br> \textheight 1100px % <br> \topmargin -105px % <br> \oddsidemargin -72px % <br> \usepackage{graphics} % <br> \usepackage{rotating} % <br> \newcommand \sx {\scalebox} % <br> \newcommand \rot {\begin{rotate}} % <br> \newcommand \ero {\end{rotate}} % <br> \newcommand \ing {\includegraphics} % <br> \newcommand \rmi {\mathrm{i}} % <br> \begin{document} % <br> \newcommand \zoomax { % <br> \put(184,989){\sx{2.8}{$y$}} % <br> \put(184, 893){\sx{2.6}{$7$}} % <br> \put(184, 793){\sx{2.6}{$6$}} % <br> \put(184, 693){\sx{2.6}{$5$}} % <br> \put(184, 593){\sx{2.6}{$4$}} % <br> \put(184, 493){\sx{2.6}{$3$}} % <br> \put(184, 393){\sx{2.6}{$2$}} % <br> \put(184, 293){\sx{2.6}{$1$}} % <br> \put(184, 193){\sx{2.6}{$0$}} % <br> \put(170, 092){\sx{2.6}{$-\!1$}} % <br> %\put(-1, 010){\sx{2.6}{$-\!2$}} % <br> %\put(016, -4){\sx{2.6}{$-\!2$}} % <br> \put(080,176){\sx{2.6}{$-\!1$}} % <br> \put(195,176){\sx{2.6}{$0$}} % <br> \put(295,176){\sx{2.6}{$1$}} % <br> %\put(435, -5){\sx{3}{$2$}} % <br> \put(386,179){\sx{2.7}{$x$}} % <br> } % <br> \parindent 0pt % <br> \sx{1}{\begin{picture}(852,1002) % <br> %\put(40,20){\ing{b271tMap3}} % <br> \zoomax % <br> \put(0,0){\ing{TetPlot}} % <br> \put(222,642){\sx{2.5}{$y\!=\!\mathrm{tet}(x)$}} % <br> \put(024,44){\sx{2.5}{$y\!=\!\mathrm{tet}(x)$}} % <br> \put(334,572){\sx{2.5}{$y\!=\!\mathrm e^x$}} % <br> \put(010,232){\sx{2.5}{$y\!=\!\mathrm e^x$}} % <br> \put(204,259){\sx{1.7}{$y\!=\!10\Big(\mathrm{tet}(x)-(x\!+\!1)\Big)$}} % <br> \put(72,130){\sx{1.9}{$y\!=\!10\Big(\mathrm{tet}(x)-(x\!+\!1)\Big)$}} % <br> \end{picture}} % <br> \end{document} % <br>
File history
Click on a date/time to view the file as it appeared at that time.
| Date/Time | Thumbnail | Dimensions | User | Comment | |
|---|---|---|---|---|---|
| current | 17:50, 20 June 2013 | 838 × 2,088 (124 KB) | Maintenance script (talk | contribs) | Importing image file |
- You cannot overwrite this file.
File usage
The following page links to this file: