Search results
Create the page "Contamination" on this wiki! See also the search results found.
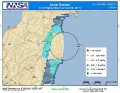
File:NISAdoe1.jpg Map of contamination after the [[Fukushima disaster]](769 × 595 (108 KB)) - 09:38, 21 June 2013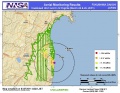
File:NISAdoe2.jpg Data about contamination after the [[Fukushima disaster]](779 × 602 (110 KB)) - 09:38, 21 June 2013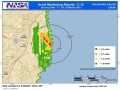
File:NISAdoe3.jpg Map of contamination after the [[Fukushima disaster]](769 × 577 (95 KB)) - 09:38, 21 June 2013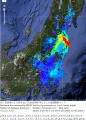
File:Nnistar01.jpg Map of contamination of Japan after the Fukushima disaster by [[Category:Maps of contamination]](1,461 × 2,045 (952 KB)) - 09:39, 21 June 2013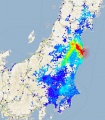
File:Nnistar04a.jpg Map of contamination of Japan after the Fukushima disaster by [[Category:Maps of contamination]](1,474 × 1,683 (166 KB)) - 09:39, 21 June 2013
File:Nnistar04b.png Scale for Map of contamination of Japan, after the Fukushima disaster by [[Category:Maps of contamination]](944 × 54 (12 KB)) - 09:39, 21 June 2013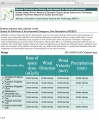
File:Nodata.jpg where the data about the radioactive contamination in the Miuyagi prefecture were supposed to appear. The state for 2011 April The screenshot is saved as an illustration of the lack of data about the contamination that are supposed to be released by the Japanese authorities.(1,055 × 1,272 (449 KB)) - 09:38, 21 June 2013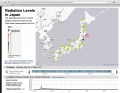
File:Nosendaintera00.jpg ...(which suggests roughly 1000mSv/year), confirming that the main source of contamination is not at Fukushima-1 nuclear plant, at least for period 2011 March 14 Marc(1,334 × 1,029 (86 KB)) - 09:38, 21 June 2013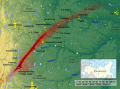
File:Ostural-Spur.png Thomas B. Cochran, Robert Standish Norris, Kristen L. Suokko: Radioactive Contamination at Chelyabinsk-65, Russia. In: Annual Review of Energy and the Environment.(1,070 × 790 (1.38 MB)) - 09:39, 21 June 2013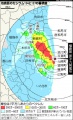
File:Radiation-map-fukushima1.jpg Map of contamination after the [[Fukushima disaster]]. [[Category:Maps of contamination]](304 × 500 (85 KB)) - 09:38, 21 June 2013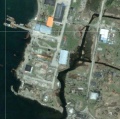
File:Shikotango.jpg ...age is got through the GoogleMap for the analysis of possible source(s) of contamination that is usually attributed to the [[Fukushima disaster]].(762 × 757 (175 KB)) - 09:38, 21 June 2013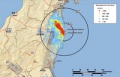
File:Si-radiation-thumb-200xauto-6005.jpg Map of contamination in Japan after the [[Fukushima disaster]] by U.S. Department of Energy (DOE(200 × 128 (17 KB)) - 11:23, 21 June 2013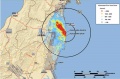
File:Si-radiation-thumb-200xauto-6005b.jpg Cumulative Aerial map of contamination after the [[Fukushima disaster]] for(1,520 × 1,002 (71 KB)) - 09:38, 21 June 2013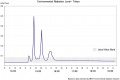
File:Tokyo2011march14-19mext.jpg Monitoring level of the radioactive contamination due to the [[Fukushima disaster]] in Tokyo in 2011 March 14 - March 19 my t(1,076 × 715 (62 KB)) - 09:38, 21 June 2013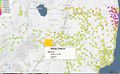
File:2013.09.13.odakura.jpg Snapshot of the map of contamination(1,545 × 953 (547 KB)) - 13:50, 12 September 2013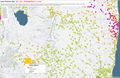
File:2013.09.25.Odakura.jpg Contamination:(1,692 × 1,098 (257 KB)) - 22:09, 25 September 2013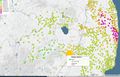
File:2013.10.07.nishigo.jpg Contamination map for 2013.10.07 by(1,537 × 985 (391 KB)) - 08:26, 1 December 2018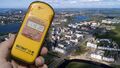
File:2019.08.09NenoksaRadiation.jpg “I think the radioactive contamination was fairly weak and the consequences will be [felt by] the people who were(1,360 × 765 (398 KB)) - 20:59, 10 August 2019
File:DoNotApproach.jpg Patient, carrying the [[coronavirus]], protects the people from contamination.(960 × 732 (80 KB)) - 10:04, 14 March 2020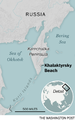
File:KhalaktyrskyBeachWP.png ...ow at Khalaktyrsky Beach, the situation seems better, but we know that the contamination just moved south because people there are seeing the signs with the dead an(604 × 967 (403 KB)) - 08:58, 12 October 2020


