Search results
Create the page "Contamination" on this wiki! See also the search results found.
File:C2011mar16a.jpg Map of contamination due to the [[Fucushima disaster]] for March 16, 2011 by data from(2,375 × 2,917 (207 KB)) - 10:19, 21 June 2013
File:C2011mar16c.jpg Map of contamination of Japan due to the [[Fukushima disaster]] for 2011 March 16, plotted by th(2,375 × 2,917 (405 KB)) - 17:50, 20 June 2013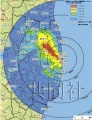
File:47ae1 F59A51E334FB791F36AB413B5BC15C0C.jpg leading to the map of nuclear contamination of Japan in 2011 from ...eyword.info/japan-drawn-with-the-united-states-announced-nuclear-radiation-contamination-map-figure/(230 × 300 (25 KB)) - 09:38, 21 June 2013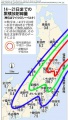
File:4t1.jpg Map of contamination that is usually attributed to the [[Fukushima disaster]], average for 2011 ...information do I expect from the colleagues who work in monitoring of the contamination. I hope they can do it much better than I did. The detailed professional ma(789 × 1,391 (86 KB)) - 09:38, 21 June 2013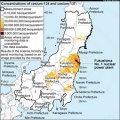
File:AJ2011111217322M.jpg Map of contamination after the [[Fukushima disaster]] reported by [[Asahi Shinbun]] for(375 × 375 (156 KB)) - 16:14, 28 December 2018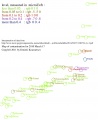
File:C2011mar17.jpg Map of contamination due to the [[Fukushima disaster]] for 2011 Mar 17(2,375 × 2,917 (415 KB)) - 09:38, 21 June 2013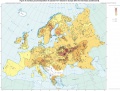
File:ChernobylEurope03.jpg Map of contamination with Cs in Europe by the UN report of year 2000,(1,263 × 960 (108 KB)) - 10:21, 21 June 2013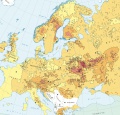
File:ChernobylEuropeCut2a.jpg Cut from the map of contamination of Europe with Cs-137 for y.2008 from the [[File:AJ2011111217322M.jpg|left|500px| Map or contamination after the Fukushima disaster for 2011 November 11 by(1,074 × 1,030 (483 KB)) - 09:38, 21 June 2013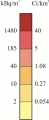
File:ChernobylEuropeNota0a1.jpg Notations for the map of contamination of Europe with Cs-137 for year 2008 by(294 × 717 (30 KB)) - 09:38, 21 June 2013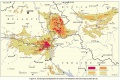
File:ContaminationMap Cs BeUkRu Fig VI.jpg Map of contamination of the Chernobyl region and vicinities by(800 × 536 (108 KB)) - 10:23, 21 June 2013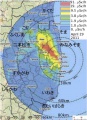
File:Fukushima-ground-ra7.jpg Map of contamination after the [[Fukushima disaster]]. http://maptd.com/new-fukushima-contamination-map/ New Fukushima contamination map. Posted on May 10, 2011 by James(594 × 822 (43 KB)) - 09:38, 21 June 2013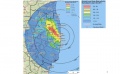
File:Fukushima-ground-radiation.jpg http://maptd.com/new-fukushima-contamination-map/ New Fukushima contamination map. Posted on May 10, 2011 by James(640 × 396 (45 KB)) - 09:38, 21 June 2013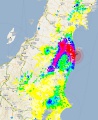
File:Fukushima2011july18a.jpg Map of contamination attributed to the [[Fukushima disaster]], image from If the authorities cannot draw the unambiguous map of contamination, there is no reason to expect that they can handle a nuclear power plant in(735 × 900 (232 KB)) - 09:39, 21 June 2013
File:Fukushima2011july18b.jpg Scale for the map [[File:Fukushima2011july18a.jpg|right|300px]] of contamination attributed to the [[Fukushima disaster]], snapshot of the state for 2011 Ju(1,745 × 54 (50 KB)) - 09:39, 21 June 2013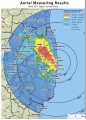
File:Fukushima 180511.jpg The scale levels of contamination becomes readable the strong zooming-in of the upper right corner. The follo contamination from $3\,\mathrm{MBq/m^2}$ to $30 \, \mathrm{MBq/m^2}$(650 × 904 (255 KB)) - 09:38, 21 June 2013
File:FukushimaReport2011may2fig2.jpg ...measured levels of the radioactive contamination; yet, the official map of contamination does not seem to be released.(864 × 1,038 (53 KB)) - 09:38, 21 June 2013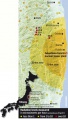
File:Image-202028-galleryV9-ehmb.jpg Map of radioactive contamination for 2011 April 7 by Der Spiegel,(343 × 600 (88 KB)) - 09:38, 21 June 2013
File:Mayak1957Vurs.gif Quakutative trace of contamination after the explosion at the nuclear industry Mayak 1957 September 29 by ...he general bolshevik's politics of barbarian use of the land leaded to the contamination of the huge areas of the USSR,(850 × 454 (28 KB)) - 09:39, 21 June 2013
File:Naoto332x252.jpg ...pril of 2011, its rank raised since 4 to 7. The publication of the map of contamination after that catastrophe lated for several months.(332 × 252 (66 KB)) - 15:26, 28 December 2018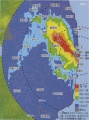
File:Newton2011 7 27b.jpg Map of contamination after the [[Fukushima disaster]]. The intermediate blue represents the Pacific Ocean, that does not show its contamination at the aerial view.(1,025 × 1,377 (81 KB)) - 09:38, 21 June 2013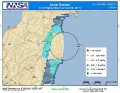
File:NISAdoe1.jpg Map of contamination after the [[Fukushima disaster]](769 × 595 (108 KB)) - 09:38, 21 June 2013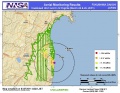
File:NISAdoe2.jpg Data about contamination after the [[Fukushima disaster]](779 × 602 (110 KB)) - 09:38, 21 June 2013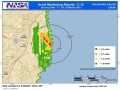
File:NISAdoe3.jpg Map of contamination after the [[Fukushima disaster]](769 × 577 (95 KB)) - 09:38, 21 June 2013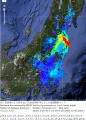
File:Nnistar01.jpg Map of contamination of Japan after the Fukushima disaster by [[Category:Maps of contamination]](1,461 × 2,045 (952 KB)) - 09:39, 21 June 2013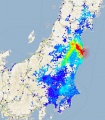
File:Nnistar04a.jpg Map of contamination of Japan after the Fukushima disaster by [[Category:Maps of contamination]](1,474 × 1,683 (166 KB)) - 09:39, 21 June 2013
File:Nnistar04b.png Scale for Map of contamination of Japan, after the Fukushima disaster by [[Category:Maps of contamination]](944 × 54 (12 KB)) - 09:39, 21 June 2013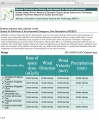
File:Nodata.jpg where the data about the radioactive contamination in the Miuyagi prefecture were supposed to appear. The state for 2011 April The screenshot is saved as an illustration of the lack of data about the contamination that are supposed to be released by the Japanese authorities.(1,055 × 1,272 (449 KB)) - 09:38, 21 June 2013
File:Nosendaintera00.jpg ...(which suggests roughly 1000mSv/year), confirming that the main source of contamination is not at Fukushima-1 nuclear plant, at least for period 2011 March 14 Marc(1,334 × 1,029 (86 KB)) - 09:38, 21 June 2013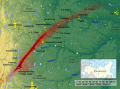
File:Ostural-Spur.png Thomas B. Cochran, Robert Standish Norris, Kristen L. Suokko: Radioactive Contamination at Chelyabinsk-65, Russia. In: Annual Review of Energy and the Environment.(1,070 × 790 (1.38 MB)) - 09:39, 21 June 2013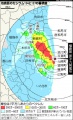
File:Radiation-map-fukushima1.jpg Map of contamination after the [[Fukushima disaster]]. [[Category:Maps of contamination]](304 × 500 (85 KB)) - 09:38, 21 June 2013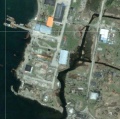
File:Shikotango.jpg ...age is got through the GoogleMap for the analysis of possible source(s) of contamination that is usually attributed to the [[Fukushima disaster]].(762 × 757 (175 KB)) - 09:38, 21 June 2013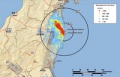
File:Si-radiation-thumb-200xauto-6005.jpg Map of contamination in Japan after the [[Fukushima disaster]] by U.S. Department of Energy (DOE(200 × 128 (17 KB)) - 11:23, 21 June 2013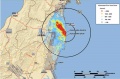
File:Si-radiation-thumb-200xauto-6005b.jpg Cumulative Aerial map of contamination after the [[Fukushima disaster]] for(1,520 × 1,002 (71 KB)) - 09:38, 21 June 2013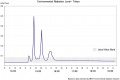
File:Tokyo2011march14-19mext.jpg Monitoring level of the radioactive contamination due to the [[Fukushima disaster]] in Tokyo in 2011 March 14 - March 19 my t(1,076 × 715 (62 KB)) - 09:38, 21 June 2013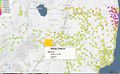
File:2013.09.13.odakura.jpg Snapshot of the map of contamination(1,545 × 953 (547 KB)) - 13:50, 12 September 2013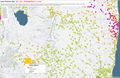
File:2013.09.25.Odakura.jpg Contamination:(1,692 × 1,098 (257 KB)) - 22:09, 25 September 2013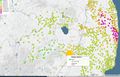
File:2013.10.07.nishigo.jpg Contamination map for 2013.10.07 by(1,537 × 985 (391 KB)) - 08:26, 1 December 2018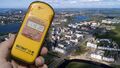
File:2019.08.09NenoksaRadiation.jpg “I think the radioactive contamination was fairly weak and the consequences will be [felt by] the people who were(1,360 × 765 (398 KB)) - 20:59, 10 August 2019
File:DoNotApproach.jpg Patient, carrying the [[coronavirus]], protects the people from contamination.(960 × 732 (80 KB)) - 10:04, 14 March 2020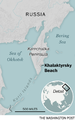
File:KhalaktyrskyBeachWP.png ...ow at Khalaktyrsky Beach, the situation seems better, but we know that the contamination just moved south because people there are seeing the signs with the dead an(604 × 967 (403 KB)) - 08:58, 12 October 2020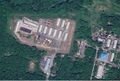
File:KirpichnayaBoderPatrolStorageMap.jpg This organization is suspected to contribute in the contamination, caused the(1,666 × 1,124 (535 KB)) - 18:41, 22 October 2020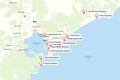
File:KamchatkaDisaster756022476201750.jpg of contaminated river and lakes of the [[Kamchatka]] peninsula; this contamination is supposed to cause the(900 × 600 (284 KB)) - 05:32, 21 October 2020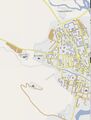
File:Vh2151mapia.jpg [[Category:Contamination]](1,194 × 1,580 (123 KB)) - 11:35, 21 October 2020
File:CottonPlant.JPG ...e with harvesting machines). This chemical is a growing source of residual contamination of soils by arsenic, which is not degradable; Photo courtesy of USDA Natura(2,100 × 1,500 (116 KB)) - 19:58, 21 August 2022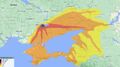
File:B4548ceca2d8f1ca8782a8f0553b440b.jpeg Forecast of contamination due to the [[Zaporizhzhia Disaster]]; the nuclear plant is expected to expl(690 × 387 (44 KB)) - 18:00, 29 August 2022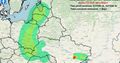
File:Mapa-poshyrennya-radiatsiyi-u-vypadku-avariyi-na-ZAES-840x441-c-1.jpg ...he event of an accident at the Zaporizhia Nuclear Power Plant, radioactive contamination would primarily affect Ukraine// ...he event of an accident at the Zaporizhia Nuclear Power Plant, radioactive contamination would primarily affect Ukraine(840 × 441 (79 KB)) - 07:34, 31 August 2022


