Search results
Create the page "Logamplitude" on this wiki! See also the search results found.
- ...ion with similar figure 1 from <ref name="analuxp"/>, where equilimes of [[logamplitude]] and [[phase]] are drown, instead of real and imaginary parts in figure at Due to the transfer equation, the change from [[logamplitude]] and [[phase]] to real and imaginary part are almost equivalent to the tr14 KB (1,972 words) - 02:22, 27 June 2020
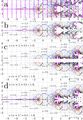
File:Analuxp01t400.jpg Lines of constant [[logamplitude]] $u$ and phase $v$ are shown in the complex plane: Note that in this figure, $u$ and $v$ are [[logamplitude]] and [[phase]] of the plotted functions; not the real and imaginary parts,(2,083 × 3,011 (1.67 MB)) - 08:29, 1 December 2018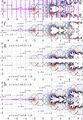
File:Analuxp01u400.jpg ...ерфункции]], the same map is shown in a different way, $u$ means logamplitude and $v$ means phase there, the lines are shown for(2,083 × 3,011 (1.72 MB)) - 08:29, 1 December 2018
File:Analuxp02t900.jpg The maps are shown with levels of [[logamplitude]] $\rho$ and [[phase]] $\varphi$;(3,362 × 1,295 (987 KB)) - 08:29, 1 December 2018

