Search results
Create the page "Red" on this wiki! See also the search results found.
Page title matches

File:Order-of-the-Red-Star.svg.png https://commons.wikimedia.org/wiki/File:Order-of-the-Red-Star.svg ...wikipedia/commons/thumb/8/8e/Order-of-the-Red-Star.svg/1074px-Order-of-the-Red-Star.svg.png(1,074 × 1,024 (235 KB)) - 08:45, 1 December 2018

Page text matches
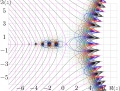
File:Factorialz.jpg ...ath>const are shown with thin blue lines for positive values and with thin red lines for negative values.<br> are shown with thick red lines.<br>(1,219 × 927 (479 KB)) - 08:35, 1 December 2018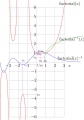
File:FactoReal.jpg Graphic of [[factorial]]<math>(x)=x!</math> versus real <math>x</math>, red;(915 × 1,310 (141 KB)) - 08:35, 1 December 2018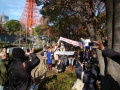
File:2011.12.10Banners.jpg The red construction behind trees is the [[Tokyo Tower]].(2,592 × 1,944 (420 KB)) - 09:40, 21 June 2013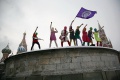
File:2012riot.jpg ...]] performing the "ПУТИН ЗАССАЛ" at the Lobnoe Mesto in Moscow (Red Square)Jan. 2012.01.20(720 × 480 (95 KB)) - 09:40, 21 June 2013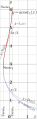
File:Acosc1plotT.png : $y=\text{acosc}_1(x)$ is shown with thick red line.(851 × 2,728 (203 KB)) - 09:41, 21 June 2013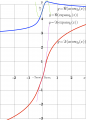
File:Acosq1plotT.png ...\Im(\mathrm{acosq}_1(x))$ are plotted versus $x$ with thick blue and thick red lines.(2,512 × 3,504 (379 KB)) - 09:41, 21 June 2013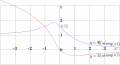
File:AcosqplotT100.png $y=\Im(\mathrm{acosq}(x))$ is shown with red line.(2,231 × 1,215 (152 KB)) - 09:41, 21 June 2013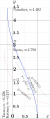
File:AsincplotT500.png ...cit plot of functions [[ArcSinc]] (thick blue curve) and [[ArcCosc]] (thin red curve):(843 × 2,014 (184 KB)) - 09:41, 21 June 2013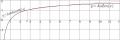
File:AuZexLamPlotT.jpg ...t plot]] of functions [[AuZex]] (thick black curve) and [[LambertW]] (thin red curve).(2,508 × 841 (169 KB)) - 08:30, 1 December 2018
File:BesselY0J0J1plotT060.png [[Explicit plot]] of [[BesselY0]] (red), [[BesselJ1]] (green) and [[BesselJ0]] (blue).(1,362 × 217 (47 KB)) - 09:42, 21 June 2013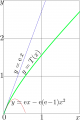
File:DoyaplotTc.png \definecolor{red}{rgb}{1,0.1,0.1} %<br>(881 × 1,325 (95 KB)) - 09:43, 21 June 2013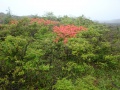
File:DSC01598akaiHana1.jpg Red flowers on the way.(3,648 × 2,736 (1.85 MB)) - 09:42, 21 June 2013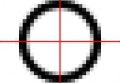
File:Eps32x22ringRoster.jpg The red cross is drawn with the [[EPS]] commands [[moveto]], [[lineto]], [[stroke]](322 × 222 (13 KB)) - 09:39, 21 June 2013
File:Eps32x22ringVector.jpg The red cross is drawn with the [[EPS]] commands [[moveto]], [[lineto]], [[stroke]](322 × 222 (12 KB)) - 09:39, 21 June 2013
File:Fafo2test0.gif ...s in vicinity of the origin of coordinates. This center is marked with the red cross.(642 × 642 (4 KB)) - 10:32, 21 June 2013
File:Fafo2test0.png ...nted at the 32 x 32 grid; the origin of the coordinates is marked with the red cross.(642 × 642 (5 KB)) - 09:39, 21 June 2013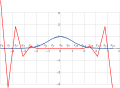
File:FFTexample16T.png Comparison of the discrete Fourier transform, shown with red,(2,101 × 1,536 (155 KB)) - 09:39, 21 June 2013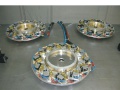
File:FiberDiskLasers.jpg ...D; the white boxes are the adjusters necessary to activate each diode. The red and blue wires deliver few kW of electric power. Two black tubes provide th(720 × 540 (48 KB)) - 10:44, 21 June 2013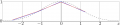
File:FourierExampleGauss04Ta.png The numerical Fourier transform $B$ is shown with red segmented line.(1,287 × 266 (35 KB)) - 09:39, 21 June 2013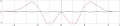
File:FourierExampleGauss16pol04Ta.png ...ctically overlapped with the evaluation of its the Fourier transform, $B$, red curve,(2,134 × 470 (88 KB)) - 09:39, 21 June 2013


