File:2014specula.png
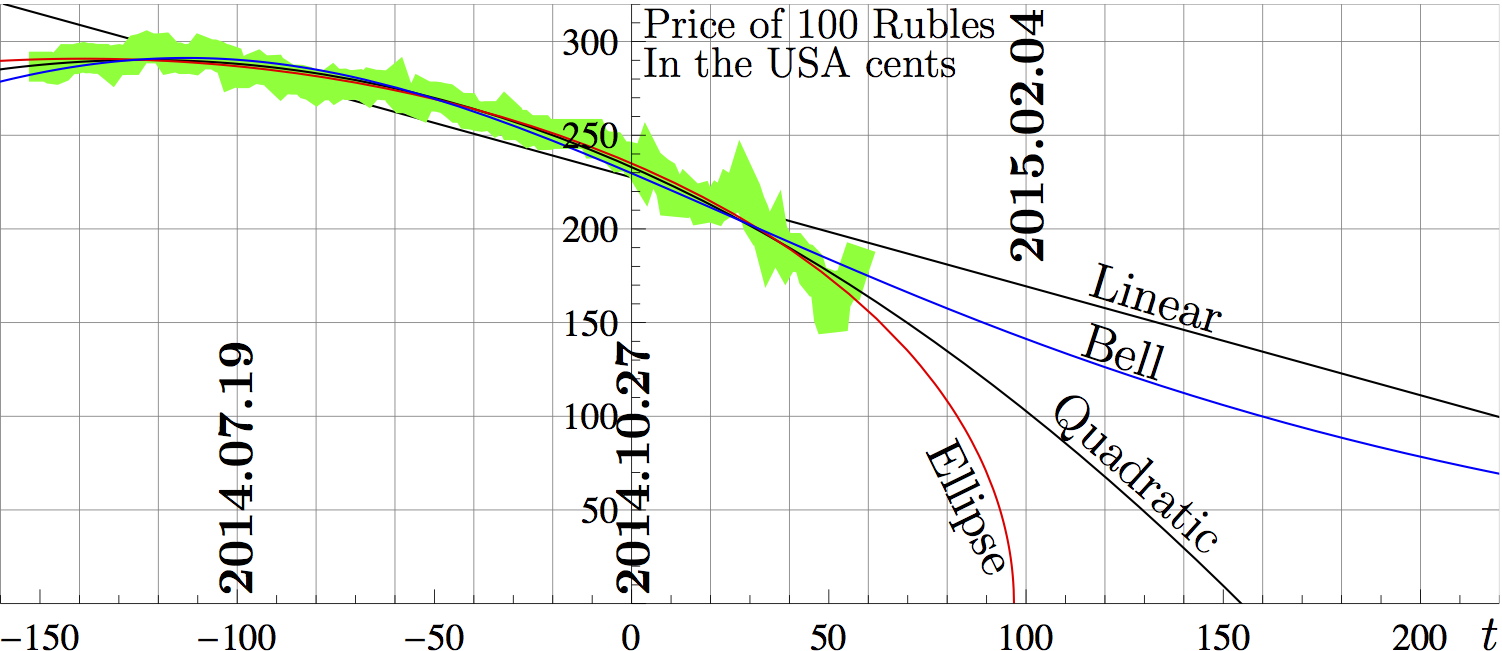
Price of 100 roubles measured in the USA cents.
The abscissa $t$ has sense of time, measured in days since the beginning of the project, 2014.10.27.
Ordinate $y$ represents the price of 100 roubles, measured in the USA cents.
The thick scratched line represents the experimental data by https://www.mataf.net/en/currency/converter-USD-RUB
Other curves correspond to the approximations with elementary functions.
Contents
Linear approximation
The black straight line shows the linear approximation,
$y=\mathrm{Linear}(t) = 227.515 - 0.581475 t$
The mean square deviation of experimental data from this approximation
$\displaystyle D_2= \sqrt{ \frac{1}{M} \sum_{m=1}^M (g_m-\mathrm{Linear}(t_m) )^2} \approx 13.1945$
The mean deviation
$\displaystyle D_1= \frac{1}{M} \sum_{m=1}^M |g_m-\mathrm{Linear}(t_m) | \approx 10.5245 $
Here, $g_m$ is value of price, measured at time $t=t_m$; and $M$ is number of experimental data available for the analysis.
Quadratic approximation
The black curve shows the quadratic function
$y=\mathrm{Quadratic}(t)=232.974 - 0.926709 t - 0.00375255 t^2 $
The mean square deviation for this approximation
$\displaystyle D_2= \sqrt{ \frac{1}{M} \sum_{m=1}^M (g_m-\mathrm{Bell}(t_m) )^2} \approx 5.52048$
The mean deviation
$\displaystyle D_1= \frac{1}{M} \sum_{m=1}^M |g_m-\mathrm{Bell}(t_m) | \approx 3.79905$
Bell approximation
The blue curve shows the Bell function
$\displaystyle y=\mathrm{Bell}(t)=\frac{1}{0.000838453 \exp(-0.00635126 t) + 0.00351499 \exp(0.00635126 t)}$
The mean square deviation for this approximation is
$\displaystyle D_2= \sqrt{ \frac{1}{M} \sum_{m=1}^M (g_m-\mathrm{Bell}(t_m) )^2} \approx 6.91678$
The mean deviation
$\displaystyle D_1= \frac{1}{M} \sum_{m=1}^M |g_m-\mathrm{Bell}(t_m) | \approx 4.90078$
Ellipse approximation
The red ellipse arc shows the function
$y=\mathrm{Ellipse}(t) =1.23211 \sqrt{(96.9365 - t) (375.163 + t)}$
The mean square deviation for this approximation is
$\displaystyle D_2= \sqrt{ \frac{1}{M} \sum_{m=1}^M (g_m-\mathrm{Ellipse}(t_m) )^2} \approx 5.15039$
The mean deviation
$\displaystyle D_1= \frac{1}{M} \sum_{m=1}^M |g_m-\mathrm{Ellipse}(t_m) | \approx 3.48095$
Discussion
Up to 2014.12.24, among the approximations shown, the Ellipse provides the best agreement with experimental data.
The 4 approximations suggested can be considered as model of the inflation in Russia at the end of year 2014. Up to data, the best approximations are quadratic and elliptic, they have only 3 parameters; the agreement for the elliptic approximation is slightly better than that for the quadratic approximaiton. Both these approximations suggest the collapse of the Russian financial system in the beginning of year 2015.
It will be interesting to see, how far the good agreement of these approximations with new experimental data will be observed.
References
2014.12.25. http://ria.ru/economy/20141225/1040080154.html Силуанов: период ослабления рубля завершился. 10:47 25.12.2014 (обновлено: 11:58 25.12.2014) Как сообщил глава Минфина России, выступая в Совете Федерации, теперь идет тренд на укрепление российской валюты. МОСКВА, 25 дек — РИА Новости. Глава Минфина РФ Антон Силуанов считает, что период ослабления рубля завершен и теперь разворачивается тенденция его укрепления. .. "Период этот на наш взгляд закончился и сейчас идет тенденция укрепления рубля", — заявил он, выступая в Совете Федерации. ..
File history
Click on a date/time to view the file as it appeared at that time.
| Date/Time | Thumbnail | Dimensions | User | Comment | |
|---|---|---|---|---|---|
| current | 06:09, 1 December 2018 | | 1,502 × 651 (177 KB) | Maintenance script (talk | contribs) | Importing image file |
- You cannot overwrite this file.
File usage
There are no pages that link to this file.