Search results
Create the page "Approximation of rouble" on this wiki! See also the search results found.
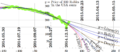
File:2014.12.26rubleDollar.png Price of 100 ruddian rubles, measured in the USA cents; data for the end of year 2014 ...dinate $x$ has sense of time, measured in days since the date of beginning of the project,(1,502 × 651 (246 KB)) - 08:26, 1 December 2018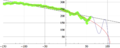
File:2014.12.29fitA300.png Price of 100 Russian roubles measured in the USA cents. ...sured in days since the date 2014.10.27, that dorresponds to the beginning of the project,(1,500 × 603 (100 KB)) - 08:26, 1 December 2018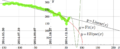
File:2014.12.29rubleDollar.png Value of 100 Russian roubles, measured in the USA cents, versus time $x$, and the ap Abscissa $x$ is time, measured in days since the beginning of the project, 2014.10.27.(1,502 × 610 (142 KB)) - 08:26, 1 December 2018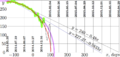
File:2014.12.31rudo.png ...the USA cents, $y$, versus time $x$, measured in days since the beginning of the project (2014.10.27). The thick ping arc covers the approximation(1,452 × 684 (190 KB)) - 08:26, 1 December 2018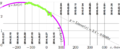
File:2014arc.png Price $y$ of Russian rouble, measured in the USA cents, versus time $x$: the lineal approximation of the data available 2014.10.27 (thin black straight line), and(1,726 × 709 (155 KB)) - 08:26, 1 December 2018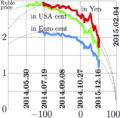
File:2014ruble15t.png Price of Russian rubble, expressed in Japanese yen (red), in the USA cents (green) a Time is measured in days. Time zero corresponds to the date of the beginning of the project, 2014.10.27.(693 × 680 (110 KB)) - 08:26, 1 December 2018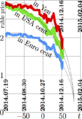
File:2014ruble17t.png [[Inflation]] of the Russian [[rouble]] at the end of year 2014. Evolution of price of [[rouble]] expressed <br>(456 × 664 (98 KB)) - 08:26, 1 December 2018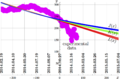
File:2014rubleDollar2param.png Price of 100 Russian roubles evaluated in the USA cents versus time. TIme$x$ is measured in days since the beginning of the project, 2014.10.27.(1,527 × 1,004 (232 KB)) - 08:26, 1 December 2018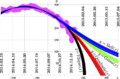
File:2014rubleDollar3param.png Price of 100 Russian roubles, evaluated in the USA cents, versus time. Time $x$ is measured in days since the beginning of the project, 2014.10.27.(1,273 × 837 (294 KB)) - 08:26, 1 December 2018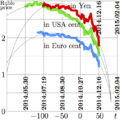
File:2014рубле16t.png ==[[C++]] generator of curves== int zero=daju24(2014,10,27); //Date of beginning of the project(680 × 680 (112 KB)) - 08:26, 1 December 2018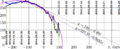
File:2015.01.03rudo.png ...ed in the USA cents, versus time $x$, measured in days since the beginning of the project, 2014.10.27. The mean square deviation between these two sets of data is about 3.(1,660 × 684 (212 KB)) - 08:26, 1 December 2018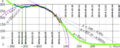
File:2015.01.05rudo.png ...ed in the USA cents, versus time $x$, measured in days since the beginning of the project (2014.10.27). The upper linear approximation $y=240-0.48x$ had been suggested 2014.10.31; it is shown also in figure htt(1,867 × 747 (271 KB)) - 08:26, 1 December 2018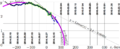
File:2015arc.png rice $y$ of Russian rouble, measured in the USA cents, versus time $x$: the lineal approximation of the data available 2014.10.27 (thin black straight line), and(1,726 × 709 (190 KB)) - 08:26, 1 December 2018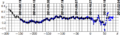
File:2015arcDev.png Deviation of the observed value of Russian rouble from the elliptic approximation Arc, versus time $x$. Value of rouble is measured in the USA cents.(888 × 261 (59 KB)) - 08:26, 1 December 2018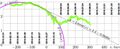
File:2015ruble2.jpg Value $y$ of Russian rubble, measured in the USA cents, versus time $x$. Time $x$ is measured in days simce the beginning of the project, 2014.10.27.(1,726 × 709 (248 KB)) - 08:26, 1 December 2018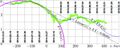
File:2015ruble3.jpg Update of file http://mizugadro.mydns.jp/t/index.php/File:2015ruble2.jpg Value $y$ of Russian rubble, measured in the USA cents, versus time $x$.(1,726 × 684 (266 KB)) - 08:26, 1 December 2018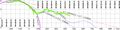
File:2016ruble1.jpg Update of image http://mizugadro.mydns.jp/t/index.php/File:2015ruble3.jpg Value $y$ of Russian rubble, measured in the USA cents, versus time $x$.(2,764 × 684 (414 KB)) - 08:27, 1 December 2018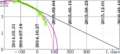
File:Roublellip.png ...imations of ruble]], that describe the [[Inflation]] of rouble in the fall of 2014, data by <br> This is update of image http://mizugadro.mydns.jp/t/index.php/File:Rusa2014.10.28t.jpg(1,519 × 689 (141 KB)) - 08:50, 1 December 2018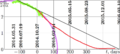
File:Ruble85210.png Forecast of value of Russian rouble (red line) measured in the USA cents by in comparison with the Linear approximation and the Circular approximation by(1,519 × 689 (116 KB)) - 08:50, 1 December 2018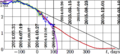
File:Ruble85210a.png Update of file The black straight line represents the [[linear approximation]] from 2014.10.27.(1,519 × 689 (217 KB)) - 08:50, 1 December 2018


