Search results
Create the page "Extrapolation" on this wiki! See also the search results found.
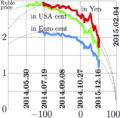
File:2014ruble15t.png Generally, extrapolation of fitting of unstable processes has pretty limited range of applicability;(693 × 680 (110 KB)) - 08:26, 1 December 2018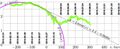
File:2015ruble2.jpg The relative deviation of this extrapolation from the experimental data remains of order of 30%.(1,726 × 709 (248 KB)) - 08:26, 1 December 2018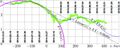
File:2015ruble3.jpg The relative deviation of this extrapolation from the experimental data remains of order of 30%.(1,726 × 684 (266 KB)) - 08:26, 1 December 2018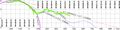
File:2016ruble1.jpg The relative deviation of this extrapolation from the experimental data remains of order of 30%. In this image, one new line is added, optimistic linear extrapolation(2,764 × 684 (414 KB)) - 08:27, 1 December 2018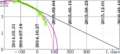
File:Roublellip.png [[Category:Extrapolation]](1,519 × 689 (141 KB)) - 08:50, 1 December 2018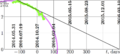
File:RubleArc.png [[Category:Extrapolation]](1,519 × 689 (132 KB)) - 08:50, 1 December 2018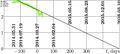
File:Rusa2014.10.28t.jpg Example of the use of the linear approximation and the linear extrapolation. .... More data are added, but the black line remains the same, this is linear extrapolation of data with non–positive values of time $t$.(1,519 × 689 (167 KB)) - 08:50, 1 December 2018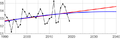
File:USAtemprtatureFit12.png [[Category:Extrapolation]](720 × 233 (24 KB)) - 23:25, 23 September 2020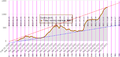
File:2021.11.28.CovidRussiaDd.png [[Category:Linear extrapolation]](1,059 × 501 (207 KB)) - 22:55, 28 November 2021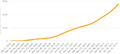
File:2021.12.05.rud.png Example: for time \(T=10^4\), the extrapolation suggests value In such a way, the extrapolation should become invalid before year 2042, mentioned in novel <ref>https://kni(787 × 351 (34 KB)) - 10:00, 5 December 2021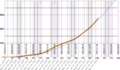
File:2021.12.05.RuDcomp.png At the qualitative extrapolation, this deviation can be neglected. The extrapolation for Russia seems to be worst among similar extrapolation for various countries:(1,483 × 870 (231 KB)) - 09:55, 5 December 2021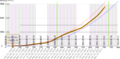
File:2021.12.07.CovidRussiaForecast.png The red and blue curves show the pessimistic and optimistic extrapolation with power functions(1,706 × 841 (314 KB)) - 11:35, 7 December 2021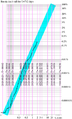
File:CovidRussiaDeath29.png The cyan strip represents the linear approximation and extrapolation. [[Category:Extrapolation]](467 × 775 (87 KB)) - 04:24, 3 January 2022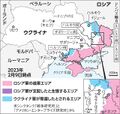
File:AS20230210003256.jpg The linear extrapolation suggests that of order of 2 years more may be required to defeat the aggres(640 × 607 (120 KB)) - 19:58, 28 February 2023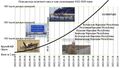
File:SpetsoperationGraphic17.jpg [[Category:Extrapolation]](745 × 421 (109 KB)) - 22:21, 24 May 2023
File:GrphicSpetsoperation2024.png Extrapolation of the [[График спецоперации]] announced by the Russian p The blue curve shows the extrapolation(1,321 × 661 (19 KB)) - 05:27, 18 May 2024


