Search results
Create the page "Linear extrapolation" on this wiki! See also the search results found.
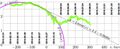
File:2015ruble2.jpg The black line shows the linear approximation, $y=2.4-0.0048x$ The approxmations Arc and Linear are mentioned in the article(1,726 × 709 (248 KB)) - 08:26, 1 December 2018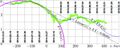
File:2015ruble3.jpg The black line shows the linear approximation, $y=2.4-0.0048x$ The approxmations Arc and Linear are mentioned in the article(1,726 × 684 (266 KB)) - 08:26, 1 December 2018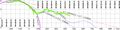
File:2016ruble1.jpg The black line shows the linear approximation, $y=2.4-0.0048x$ The approxmations Arc and Linear are mentioned in the article(2,764 × 684 (414 KB)) - 08:27, 1 December 2018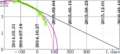
File:Roublellip.png The linear and the red extrapolations can be interpreted as "optimistic" and "pessimis [[Category:Linear approximation]](1,519 × 689 (141 KB)) - 08:50, 1 December 2018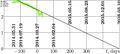
File:Rusa2014.10.28t.jpg Example of the use of the linear approximation and the linear extrapolation. the linear approximation extrapolated a year ahead, straight black line.(1,519 × 689 (167 KB)) - 08:50, 1 December 2018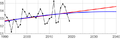
File:USAtemprtatureFit12.png for years 1990 - 2019 and the two extrapolations, linear (red) and quadratic (blue). [[Category:Extrapolation]](720 × 233 (24 KB)) - 23:25, 23 September 2020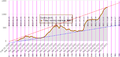
File:2021.11.28.CovidRussiaDd.png Linear extrapolations of number of daily death cases; [[Category:Linear extrapolation]](1,059 × 501 (207 KB)) - 22:55, 28 November 2021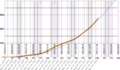
File:2021.12.05.RuDcomp.png At the qualitative extrapolation, this deviation can be neglected. The extrapolation for Russia seems to be worst among similar extrapolation for various countries:(1,483 × 870 (231 KB)) - 09:55, 5 December 2021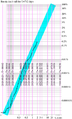
File:CovidRussiaDeath29.png The cyan strip represents the linear approximation and extrapolation. [[Category:Extrapolation]](467 × 775 (87 KB)) - 04:24, 3 January 2022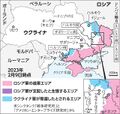
File:AS20230210003256.jpg The linear extrapolation suggests that of order of 2 years more may be required to defeat the aggres(640 × 607 (120 KB)) - 19:58, 28 February 2023


