Search results
Create the page "Linear function" on this wiki! See also the search results found.
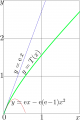
File:DoyaplotTc.png [[Doya function]] with parameter unity of real argument, $y=T(x)=\mathrm{Doya}_1(x)$ The linear approximation in vicinity of zero $y=T'(0) x =\mathrm e x~$(881 × 1,325 (95 KB)) - 09:43, 21 June 2013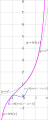
File:TetPlotU.png ...aphic of tetration $y\!=\!\mathrm{tet}(x)$ looks similar to that of linear function ...tetration $y\!=\!\mathrm{tet}(x)$ looks similar to that of the exponential function $y\!=\!\exp(x)$.(838 × 2,088 (124 KB)) - 08:53, 1 December 2018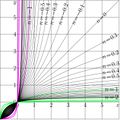
File:Fracit20t150.jpg [[Iterate of linear fraction]]; [[Category:Elementary function]](1,466 × 1,466 (463 KB)) - 08:36, 1 December 2018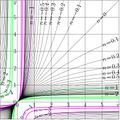
File:Fracit10t150.jpg [[Iterate of linear fraction]]; [[Category:Elementary function]](1,466 × 1,466 (564 KB)) - 08:36, 1 December 2018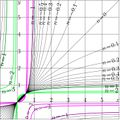
File:Fracit05t150.jpg [[Iterate of linear fraction]]; [[Category:Elementary function]](1,466 × 1,466 (441 KB)) - 08:36, 1 December 2018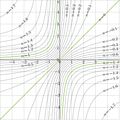
File:Frac1zt.jpg [[Iterate]]s of function $T(z)=-1/z$ The non-integer iterates of function $T$ are evaluated using the superfunction(2,089 × 2,089 (734 KB)) - 08:36, 1 December 2018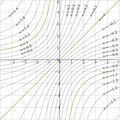
File:Frac2zt.jpg [[Iteration]] of function $T(z)=-4/z$. [[Category:Iterate of linear fraction]](2,089 × 2,089 (716 KB)) - 21:47, 29 August 2013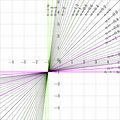
File:Itelin125T.jpg Iterates of the linear function [[Category:Linear function]](2,088 × 2,088 (893 KB)) - 08:38, 1 December 2018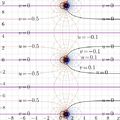
File:Fz2z1mapT.jpg [[Complex map]] of function [[Category:Linear fraction]](4,175 × 4,175 (1.57 MB)) - 08:36, 1 December 2018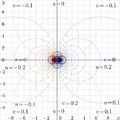
File:Gz2z1mapT.jpg [[Complex map]] of function [[Category:Abel function]](4,175 × 4,175 (1.67 MB)) - 08:37, 1 December 2018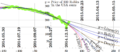
File:2014.12.26rubleDollar.png with function daju24 defined below in C++: \begin{verbatim} \rm Linear &227.323 - 0.583872 x &\! 10.52733 &\! 13.15973\\(1,502 × 651 (246 KB)) - 08:26, 1 December 2018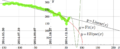
File:2014.12.29rubleDollar.png The straight black line represents the linear approximation of the data, $y=\mathrm{Linear}(x)=227.499 - 0.581655 x$(1,502 × 610 (142 KB)) - 08:26, 1 December 2018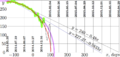
File:2014.12.31rudo.png ==Linear approximations== The thin straight lines show the two linear approximations:(1,452 × 684 (190 KB)) - 08:26, 1 December 2018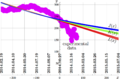
File:2014rubleDollar2param.png 10 red lines represent the linear approximations, for $M-10\le m \le M$; in such a way, for function $f=L$, 10 curves are plotted, and these curve form the red strip.(1,527 × 1,004 (232 KB)) - 08:26, 1 December 2018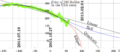
File:2014specula.png ==Linear approximation== The black straight line shows the linear approximation,(1,502 × 651 (177 KB)) - 08:26, 1 December 2018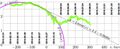
File:2015ruble2.jpg The pink arc shows function $y=\mathrm{Arc}(x)=.01\sqrt{(123-x)(471+x)}$ The black line shows the linear approximation, $y=2.4-0.0048x$(1,726 × 709 (248 KB)) - 08:26, 1 December 2018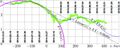
File:2015ruble3.jpg The pink arc shows function $y=\mathrm{Arc}(x)=.01\sqrt{(123-x)(471+x)} ~$ The black line shows the linear approximation, $y=2.4-0.0048x$(1,726 × 684 (266 KB)) - 08:26, 1 December 2018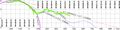
File:2016ruble1.jpg The pink arc shows function $y=\mathrm{Arc}(x)=.01\sqrt{(123-x)(471+x)} ~$ The black line shows the linear approximation, $y=2.4-0.0048x$(2,764 × 684 (414 KB)) - 08:27, 1 December 2018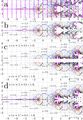
File:Analuxp01t400.jpg In this case, it is easier to guess the asymptotic behaviour of the function (last picture, d) from its primitive fit (picture b). ===a: Linear approximation by Gusmad===(2,083 × 3,011 (1.67 MB)) - 08:29, 1 December 2018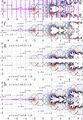
File:Analuxp01u400.jpg ===e: Linear approximation by Gusmad=== This is approximation, linear in the ramge $-1 < \Re(z) \le 0$(2,083 × 3,011 (1.72 MB)) - 08:29, 1 December 2018


